A Tale of Two Wars: Iraq & Afghanistan in the Wikileaks Diaries

The following is a demonstration in data scraping and visualization. Check out the full visualization dashboard on Tableau Public!
CLICK HERE TO ACCESS THE INTERACTIVE VISUALIZATION
The Project
In the summer of 2010, an unknown source within the Defense Department provided WikiLeaks with a highly classified database containing over 492,000 files somewhat misleadingly called the ‘War Diaries.’ Each record in the files pertains to a single ‘kinetic event,’ jargon meaning any time a situation involves potential lethality or physical harm. All together, the database appears to contain every single event from both Iraq and Afghanistan, as known to U.S. Central Command, from 2004–2009.
Each event contains full metadata with date, time, location, and more. This allows us to see the reports coming into U.S. command as they happened. Of course, while extremely detailed we should be as careful with this as any source. Fog of war, concern for the narrative of events (better known as CYA) all effect how records are produced and submitted. Subsequent investigation has in fact shown that some events recorded appear counterfactual events as journalists as uncovered them. Above all, what this allows us to reconstruct is the picture as it appeared to U.S. decision makers.
The Data
The data first appeared on WikiLeaks as the War Diaries database. While individual records are browsable, there are no tools to analyze the data en masse. As it turns out, WikiLeaks eventually released the raw data for the Afghan records in CSV form, which you can download here. However, an Iraq data set is still elusive, and when I first set out to do this, no datasets were available.
To get a copy of the site, I used the wGet tool to download a local mirror. Check out ProgrammingHistorian’s wGet tutorial here for a great guide of how to use the tool beyond this demonstration.

To install wGet…
Windows: Go here and download and run the installer, then launch your Command Prompt and follow directions below.
OSX: We need to install wGet via Homebrew on the command line. We will install Homebrew if you haven’t already. Open up your Terminal program in your Utilities folder and enter the following commands to install Homebrew and then wGet.
/bin/bash -c "$(curl -fsSL https://raw.githubusercontent.com/Homebrew/install/HEAD/install.sh)"
brew install wget
Linux: Use your system package manager to install wGet. If you have a Debian distribution like Ubuntu enter the following.
sudo apt-get install wget
All Systems: Once wGet is installed, run the following two commands to download the both sites to local mirrors. Note: this method limits the rate of download to be server-friendly.
wget https://WikiLeaks.org/irq/ -r -w 2 --limit-rate=150k
wget https://WikiLeaks.org/afg/ -r -w 2 --limit-rate=150k
Once I had the data locally, I used Python, along with a Python package installed via pip called BeautifulSoup. BeautifulSoup parses the raw HTML of the webpage files and makes it easy to search and extract specific bits of data (in this case, information about each event). The script crawls through every webpage, extracting the data, before finally outputting a large CSV (spreadsheet) file. With that, we can get to work poking at the data and seeing what we get. Here is the script, which you can access on GitHub.
CLICK HERE TO DOWNLOAD MY PYTHON SCRIPT FROM GITHUB
If you want to mess around with the data yourself without downloading/scraping the War Diaries, just use the links below!
DOWNLOAD THE EXCEL FILES BELOW
Google Earth
Several of my students were veterans who served in these conflicts and wanted different ways of interacting with the data. In additional to visualizations and videos (see below), these students wanted to be able to access and explore particular records of which they had been a part.
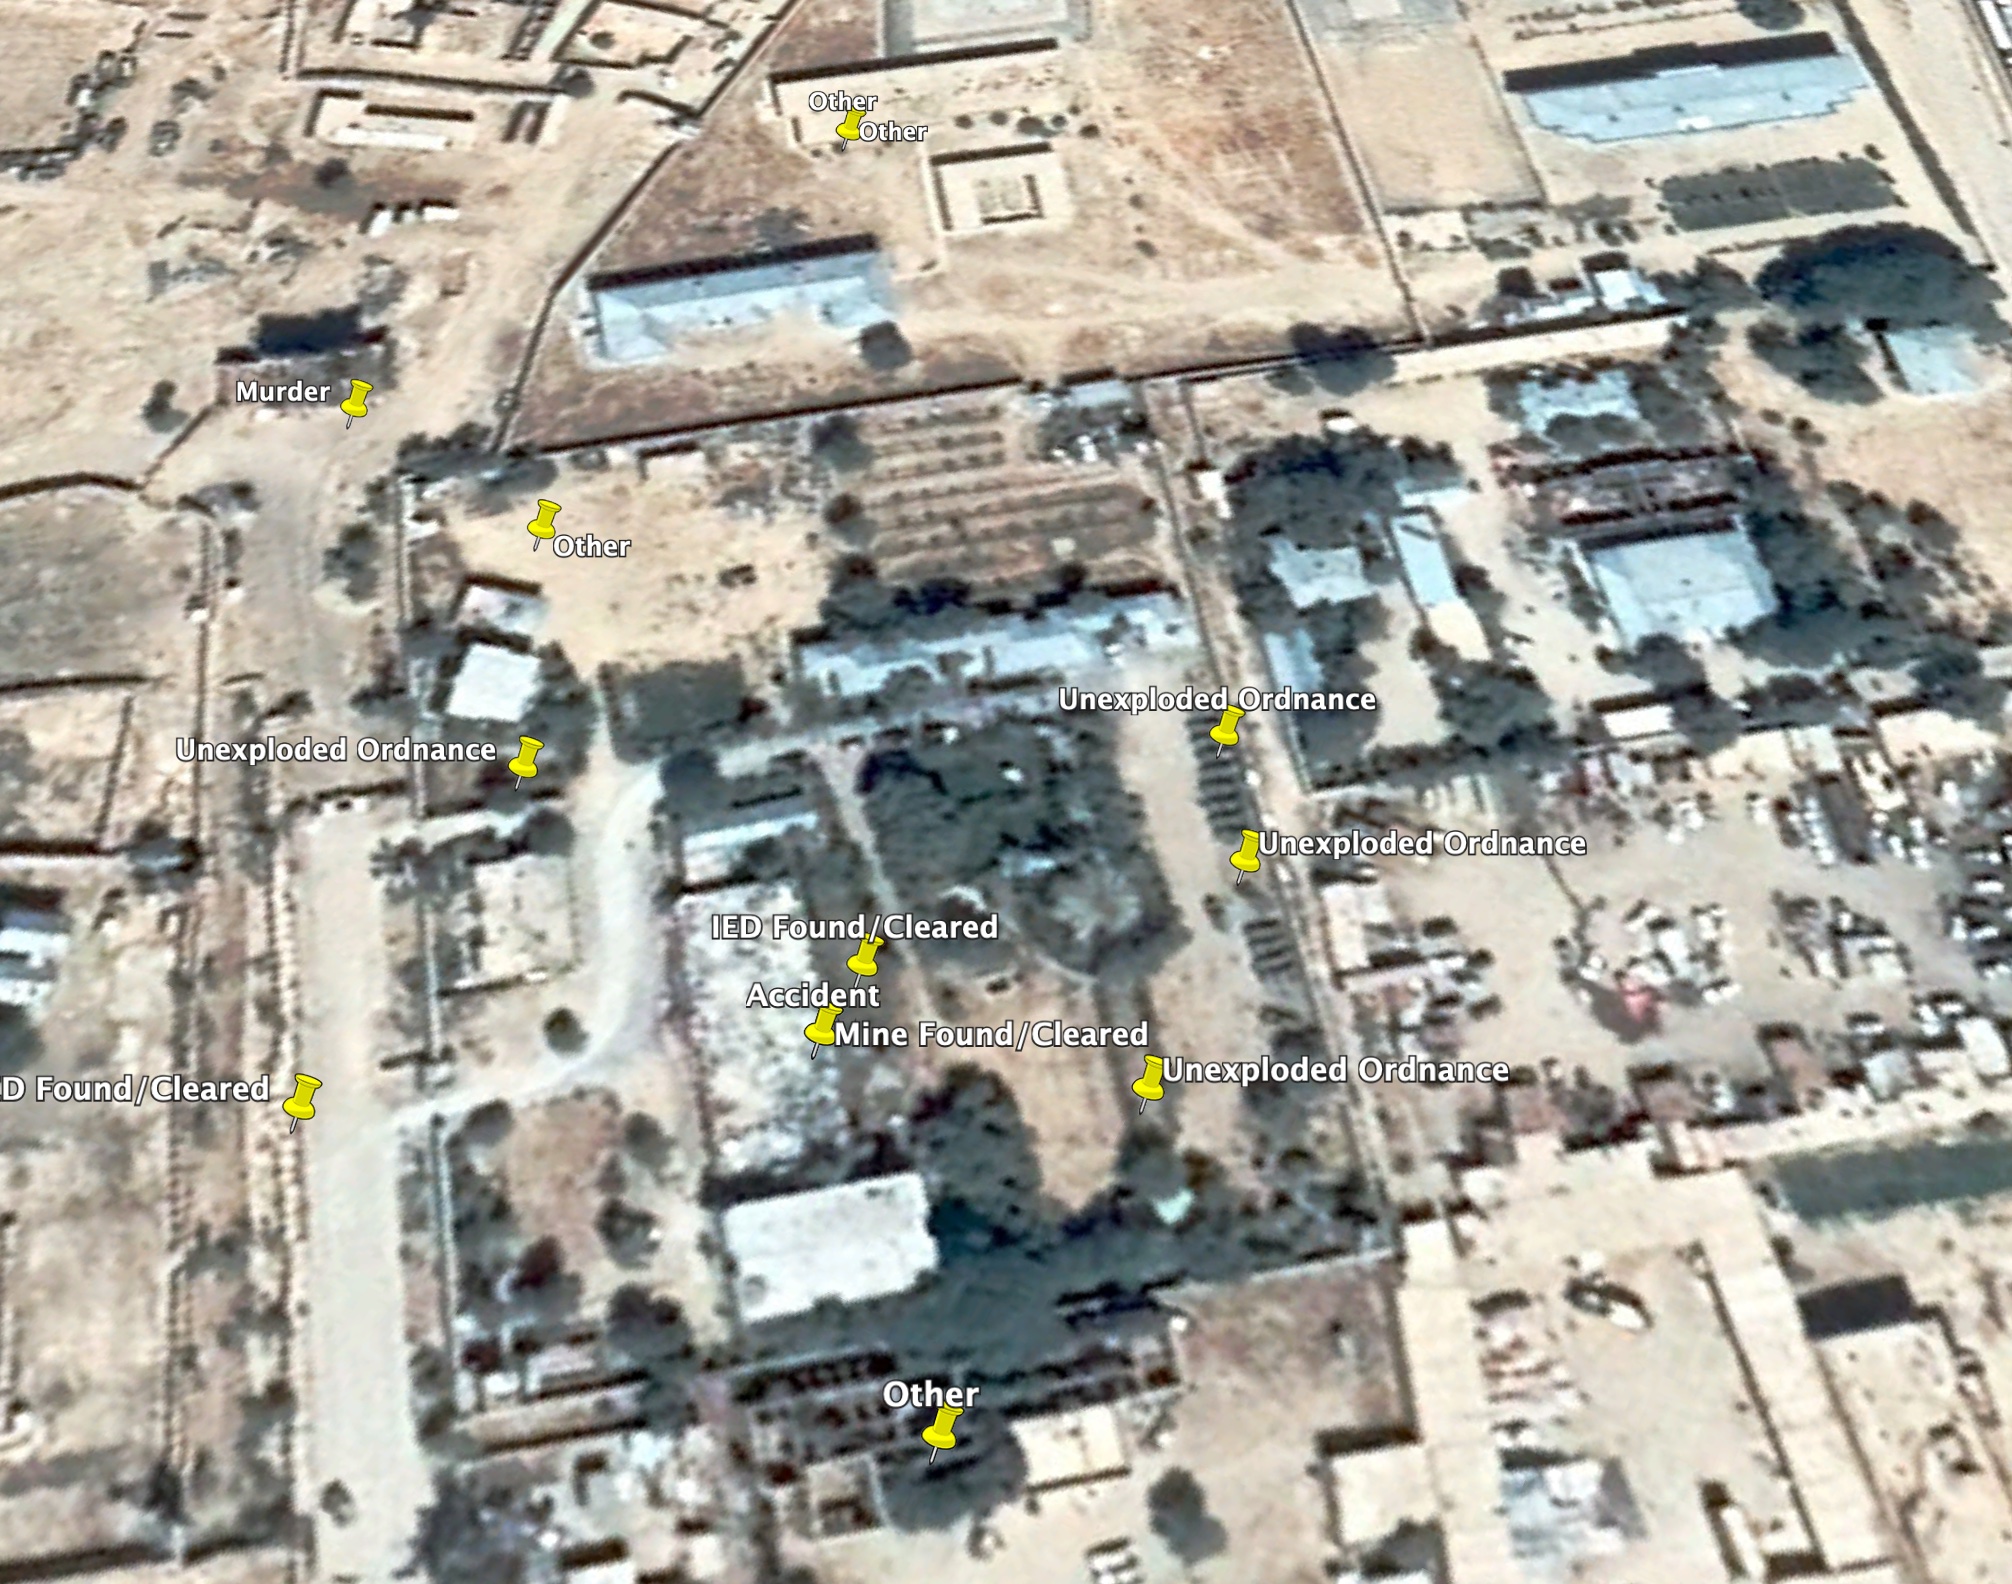
To facilitate this, I also had the script create two Google Earth .KML files. To use them, simply open Google Earth or Google Earth Pro, and choose “Open” and select the file. Beware, they will slow your computer down when you first load. My advice is to de-select to hide the pins, then zoom into an area you want to view, then re-click to enable visibility on the pins again.
DOWNLOAD THE .KML FILES BELOW
Videos
In addition to the main visualization method (Tableau) I also made some videos using Excel’s old Power Map functionality.
Visualization Method
Tableau’s free-version Tableau Public was used to create an interactive dashboard.