Visualizing USF in the News (2011-2016)
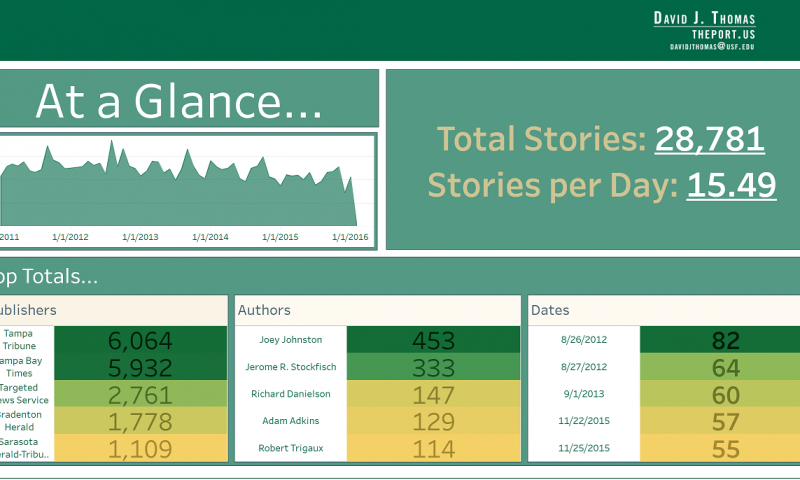
The following is a demonstration in data scraping and visualization. Check out the full visualization dashboard on Tableau Public!
CLICK HERE FOR ACCESS TO THE INTERACTIVE VISUALIZATION
The Project
On February 1st 2016, USF Libraries hosted a Digital Scholarship Faire. In order to demonstrate how quickly and easily current tools allow new insights, I performed the entire work of the project from data acquisition to visualization within the 48 hours before the faire.
The Data
The USF Libraries have access to Newsbank’s Access World News database, a collection of many thousands of the most important news publications worldwide going back to 1978. The dataset attached to this workbook has had the stories removed, for copyright reasons. This workbook is intended for demonstration purposes and is not intended for redistribution.
The Collection Method
Raw data was scraped from the web interface of the AWN database using Webscraper (webscraper.io), a free and easy extension for Chrome that lets you scrape the web graphically. Open Webscraper in the Developer Mode (F12 or Ctrl+Option+I), go to the import tab, and paste the following recipe…
{"selectors":[{"parentSelectors":["_root","browse_page_next"],"type":"SelectorLink","multiple":true,"id":"browse_page_next","selector":"li.pager-next a","delay":""},{"parentSelectors":["_root","browse_page_next"],"type":"SelectorLink","multiple":true,"id":"link_to_story","selector":"a.nb-doc-link","delay":""},{"parentSelectors":["link_to_story"],"type":"SelectorText","multiple":false,"id":"title","selector":"h2","regex":"","delay":""},{"parentSelectors":["link_to_story"],"type":"SelectorText","multiple":false,"id":"date","selector":"div.source","regex":"(?:(September|April|June|November) +(0?[1-9]|[12]\\d|30), *((?:19|20)\\d\\d))|(?:(January|March|May|July|August|October|December) +(0?[1-9]|[12]\\d|3[01]), *((?:19|20)\\d\\d))|(?:February +(?:(?:(0?[1-9]|1\\d|2[0-8]), *((?:19|20)\\d\\d))|(?:(29), *((?:(?:19|20)(?:04|08|12|16|20|24|28|32|36|40|44|48|52|56|60|64|68|72|76|80|84|88|92|96))|2000))))","delay":""},{"parentSelectors":["link_to_story"],"type":"SelectorText","multiple":false,"id":"author","selector":"li.author span.val","regex":"","delay":""},{"parentSelectors":["link_to_story"],"type":"SelectorText","multiple":false,"id":"edition","selector":"li.edition span.val","regex":"","delay":""},{"parentSelectors":["link_to_story"],"type":"SelectorText","multiple":false,"id":"section","selector":"li.section span.val","regex":"","delay":""},{"parentSelectors":["link_to_story"],"type":"SelectorText","multiple":false,"id":"column","selector":"li.column span.val","regex":"","delay":""},{"parentSelectors":["link_to_story"],"type":"SelectorText","multiple":false,"id":"page","selector":"li.page span.val","regex":"","delay":""},{"parentSelectors":["link_to_story"],"type":"SelectorText","multiple":false,"id":"source","selector":"div.source","regex":".+?(?= -)","delay":""},{"parentSelectors":["link_to_story"],"type":"SelectorText","multiple":false,"id":"text","selector":"div.body","regex":"","delay":""}],"startUrl":"PASTE_YOUR_SEARCH_RESULTS_URL_HERE_IT_WILL_BE_VERY_LONG_INCLUDE_EVERYTHING_EVEN_THE_HTTP_PART","_id":"PASTE_YOUR_SITEMAP_NAME_HERE"}
Then edit the last part of the recipe from the URLs you want to run from Newsbank. Then run the scraper to get the data!
The Visualization Method
Tableau’s free-version Tableau Public was used to create an interactive dashboard and analyze the news cycle.