Scrubbing Grungy DH Data – FL Postcards
Today we are talking about cleaning large project data sets with OpenRefine. We will be using some sample data from a now-defunct project I once worked on about historical postcards from Florida. OpenRefine will enable us to make mass edits and automatically detect similar entries. In short: it will save you endless amounts of time manually checking and correcting data! A note: OpenRefine is meant to scrub existing data, it is not meant for data entry.
Nascent Projects: The Data Dilemma
Any Digital Humanities project of any size will run into data problems. This is magnified by the fact that (due to entirely understandable constraints) many DH projects collect data in manner that would make traditional data scientists lose their minds. Simple spreadsheets are still extremely common, it’s how I first did my own graduate research project. While these are highly accessible, they are also open to data entry errors and problems of consistency in choices made by those entering the data.
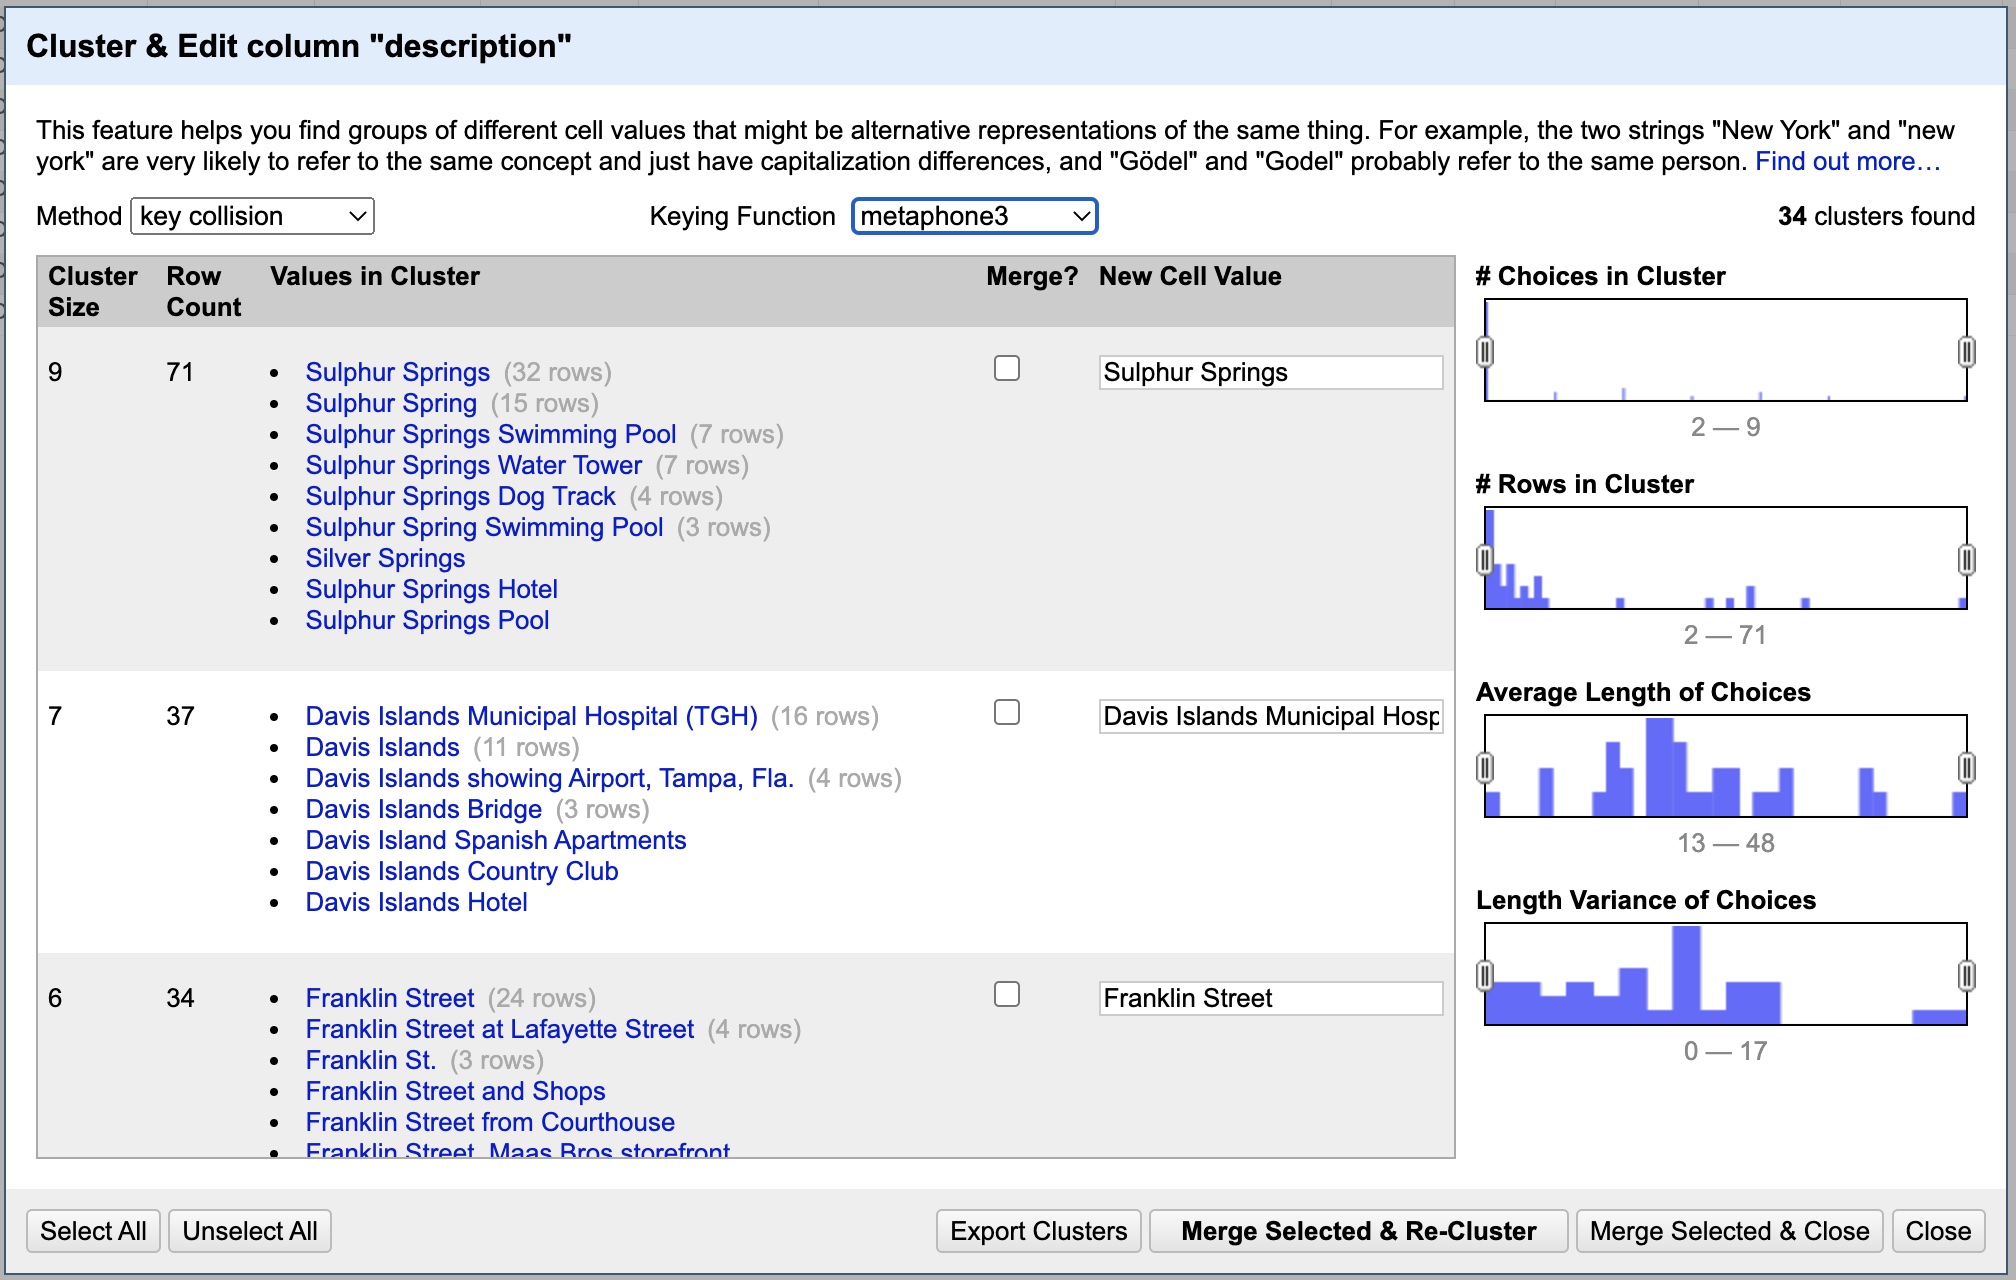
The image above (from the data we will work with) demonstrates the problem perfectly. These are the different variations people made entering the data for just one column in one table. What should have ONLY been recorded as “black_and_white” was recorded in all kinds of variants including “monochrome”. This leads to hopeless confusion quickly.
Even my graduate research project, over which I had sole and complete control, initially had issues. Beyond simple typographical mistakes, I had made slight changes in the ways I had recorded some of the data from when I started and when I finished. Yet ironing out these differences is crucial for digital projects: computers don’t understand the difference between ‘Dedication’ and ‘Dedicatory Inscription’ and counts them as entirely different things…. thus throwing any statistics into chaos. If I can’t keep consistency by myself, how can projects maintain standards with dozens (or more) volunteers who may or may not have any technical training? In an ideal world (read: not the reality of DH projects), developers could be hired to build a web interface for data entry that enforces data control through features like drop-down lists and error-checking. But the reality for many DH projects are shared Excel files or Google Sheets which are highly flexible and accessible, but easy to make mistakes in.
The solution is two-fold. The first, somewhat beyond the scope of this post, is to establish “controlled vocabulary“. This means not only determining what fields (i.e. columns) you want in your spreadsheets, but the exact terms allowed in each field. For example, in my database on Greek inscriptions, there is a field called “Object Type”… and I decided ahead of time to only allow the choices “Altar”, “Base”, “Monument”, “Column”, “Stele”, or “Other”, and no other possibility. Of course this doesn’t prevent typographical errors, but deciding a baseline ahead of time is a MUST for digital projects. You should try to schedule meetings or interactions with any project staff or volunteers doing data entry if possible in order to try and communicate the structure of your data sheets and any controlled vocabulary.
Yet, all the best preparation will not overcome data entry errors, to say nothing of the occasional creative whimsy of those doing data entry, as we will see below. The solution is to use tools to scrub the data, that is, to automatically iron out mistakes and smooth everything out nicely. While Excel can do some fixes, it is limited in scope for our needs. Once upon a time the best solution was to use programming, however since 2010 Google’s free OpenRefine project has been a powerhouse fix.
So, let’s get started! Head to OpenRefine.org….
All Users – Installing
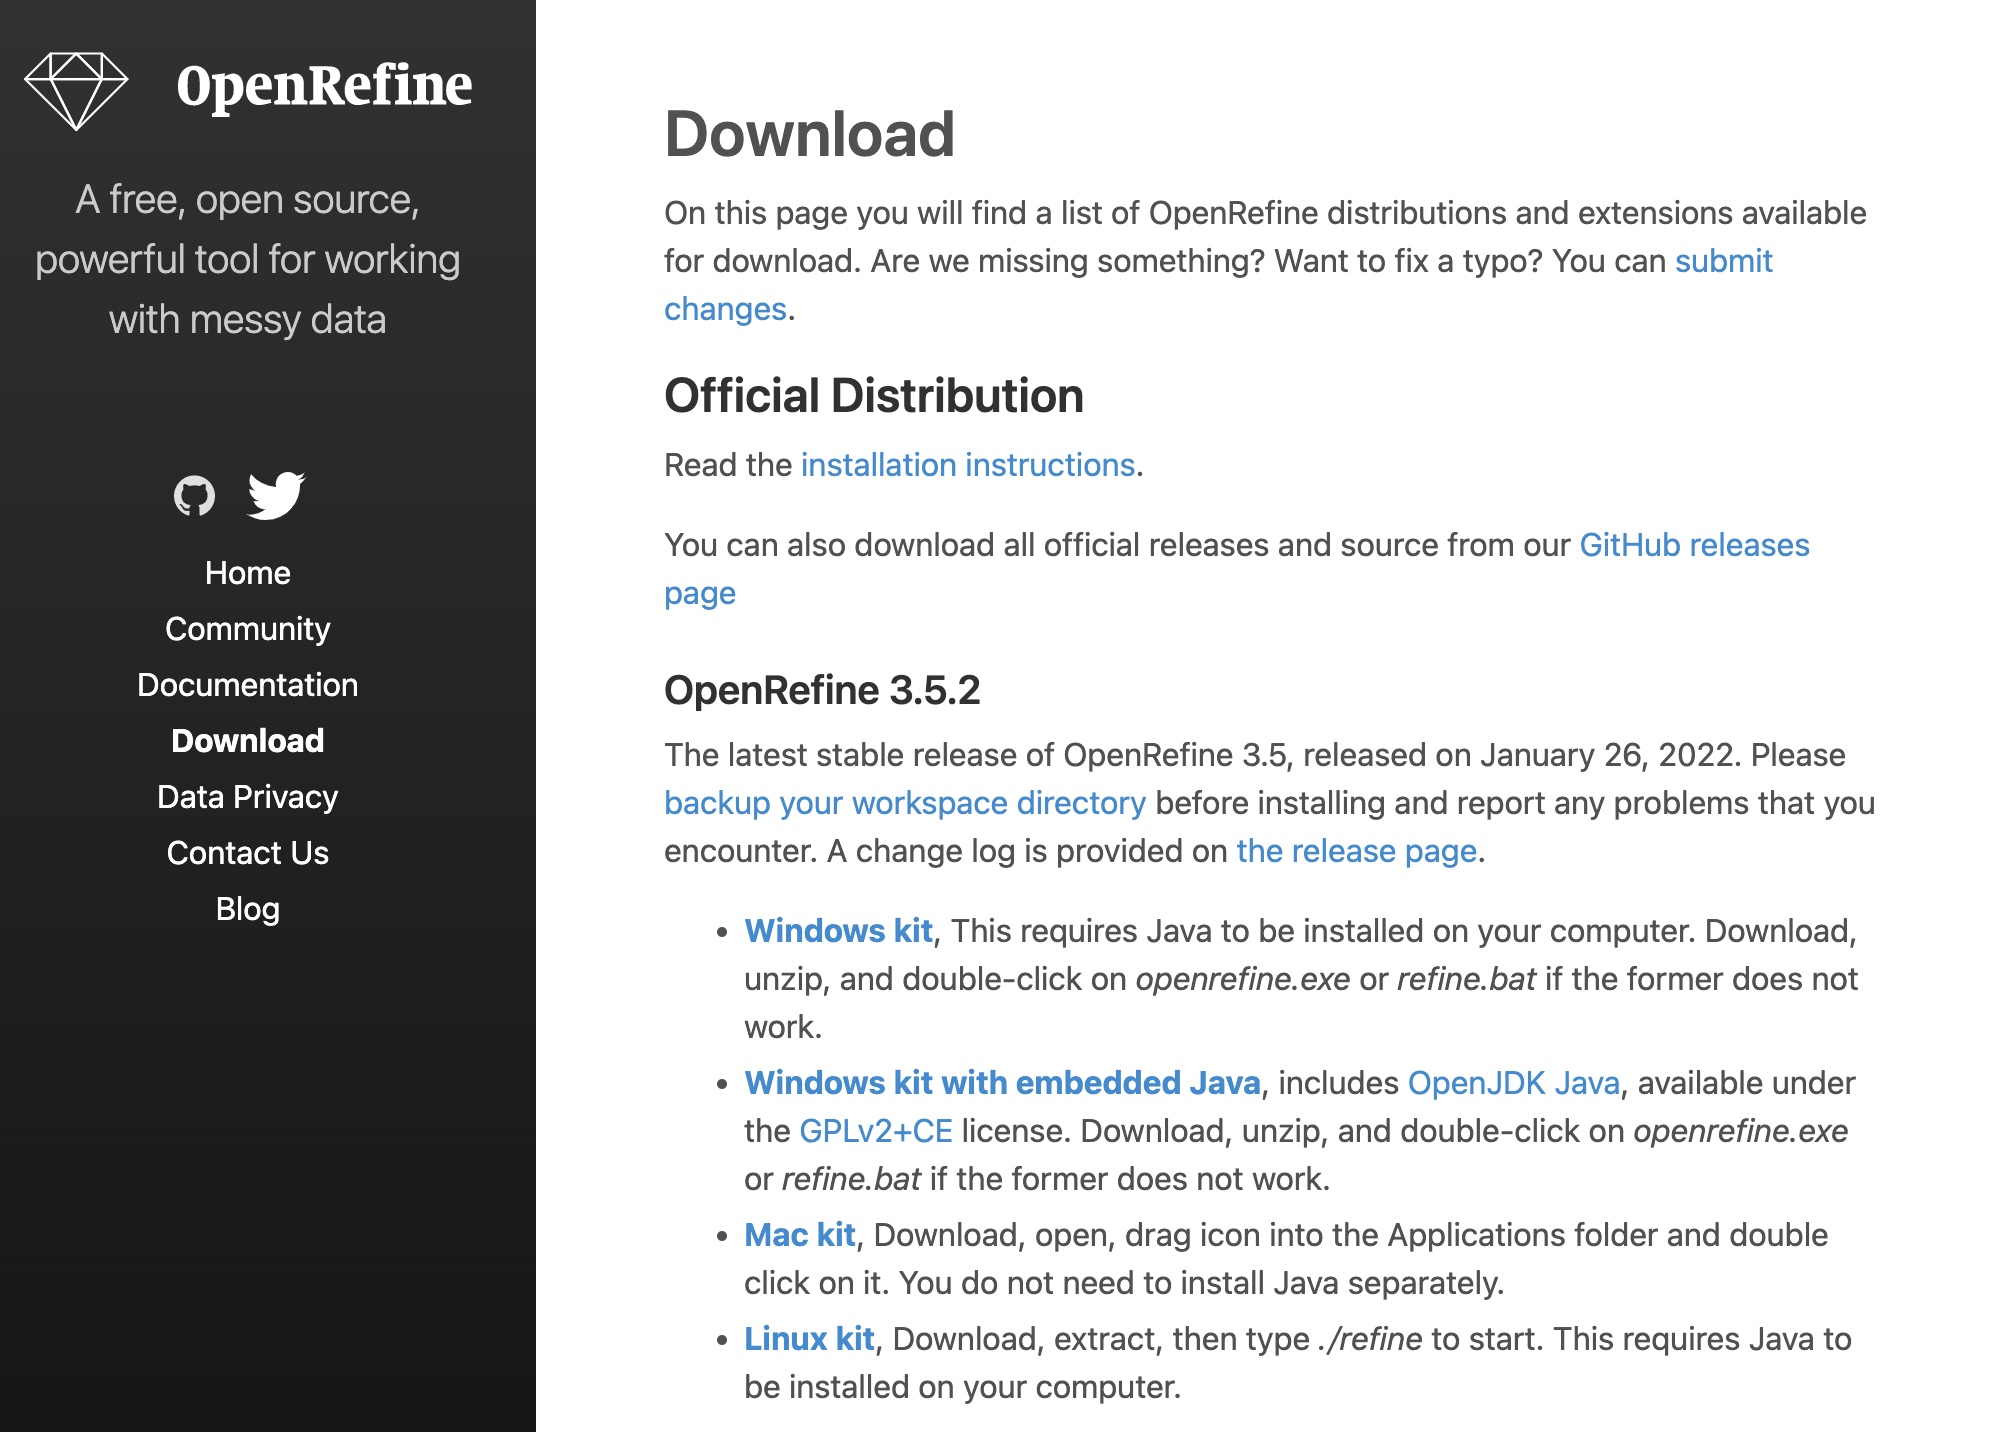
Head to the Download page and choose the version corresponding to your operating system. If you are are a Windows user and don’t know if you have Java installed, choose the second option “Windows Kit with Embedded Java.”
Head to wherever you downloaded the file. If you are on Windows, right-click the file and choose Unzip, then drag that folder to wherever you would like the final destination to be. If you are on Mac, double-click the file to open the .dmg, then drag the OpenRefine icon into your Applications folder to install.
OSX Users – Installing:
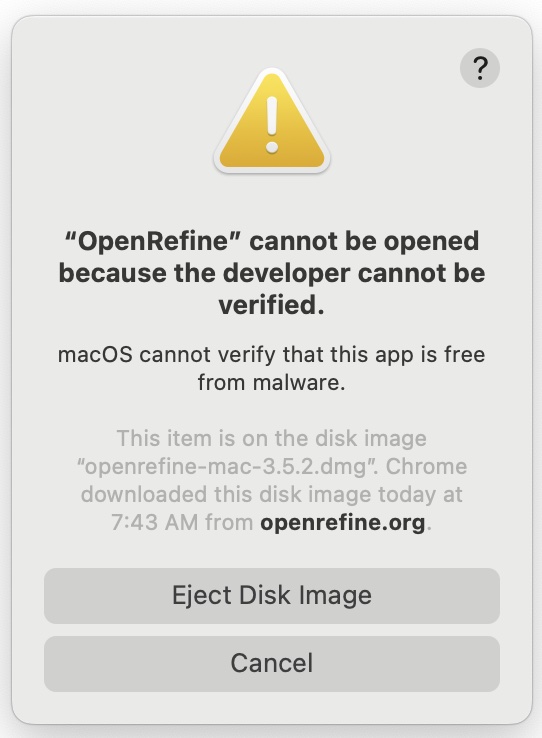
If you are on OSX you will get a security error when you try to run the application for the first time. Try it now, you should see a message like this. (we actually need to trip this error now in order to fix it). It’s fine to override this error, Apple doesn’t recognize it as a traditional application, but we know Google is the publisher and it is okay.
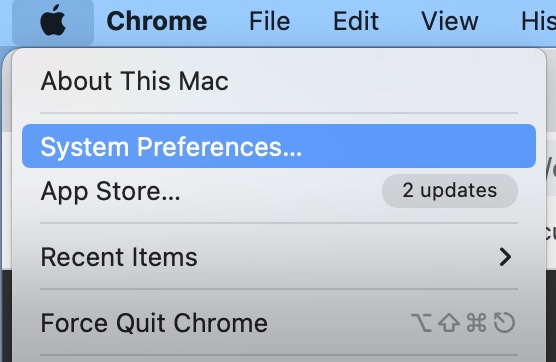
To fix this, open up your System Preferences under the Apple menu….
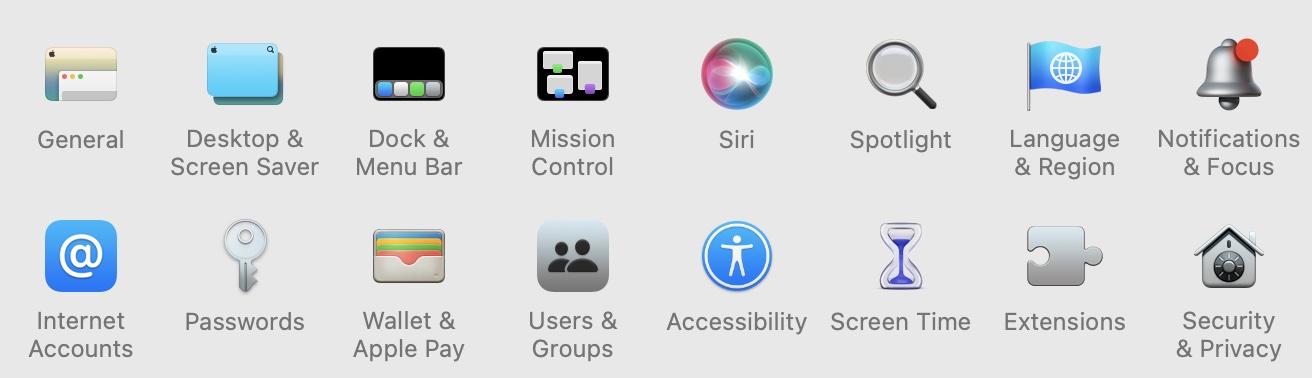
Now open your “Security & Privacy” settings, it’s often the last setting in the first major group of settings, as seen in the bottom-right of the picture below.
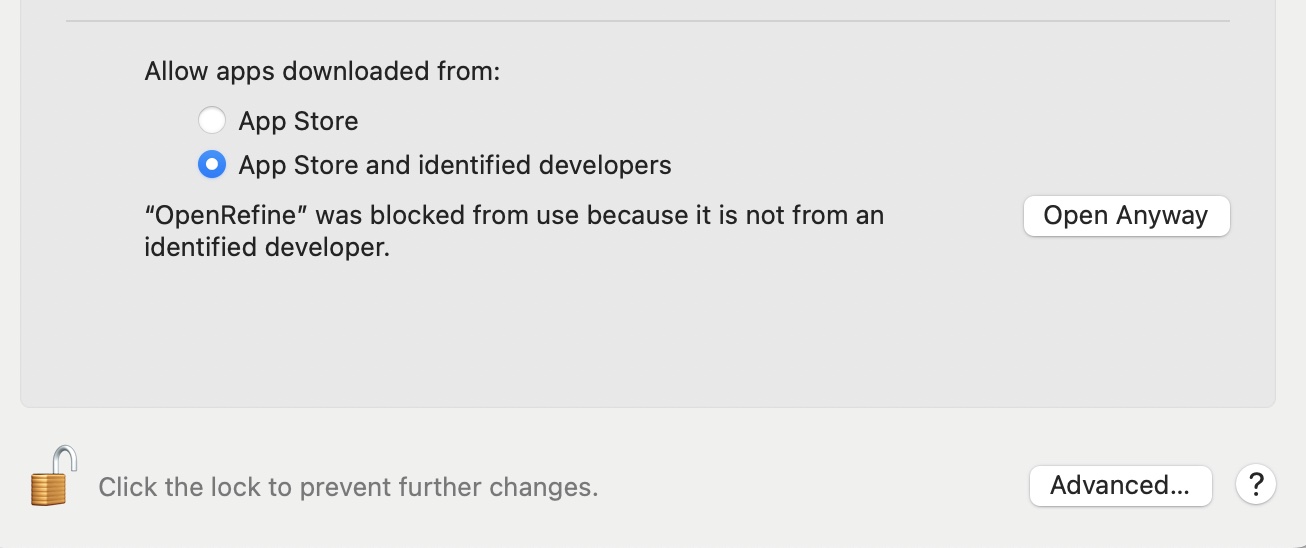
Now, with Security settings open, we first need to “unlock” the settings to make changes. To do this, click the padlock symbol in the lower-left of the panel, just left of where it says “Click the lock to make changes.” When prompted, enter your password to unlock changes.
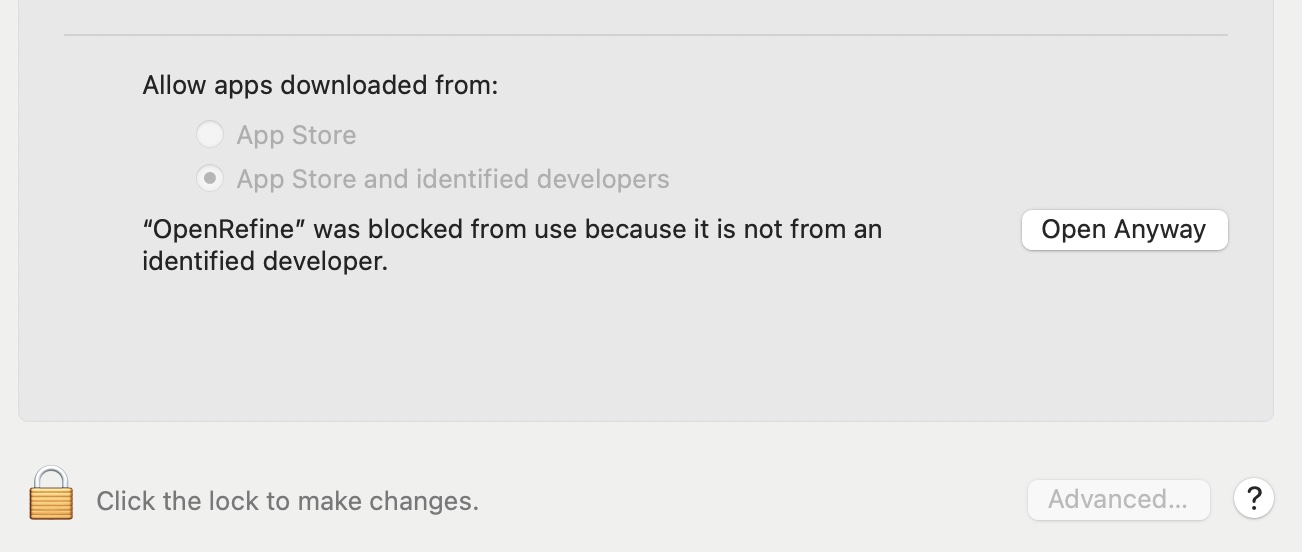
Now, to the right of where it says “‘OpenRefine’ was blocked from use because it is not from an identified developer.” Click “Open Anyway”
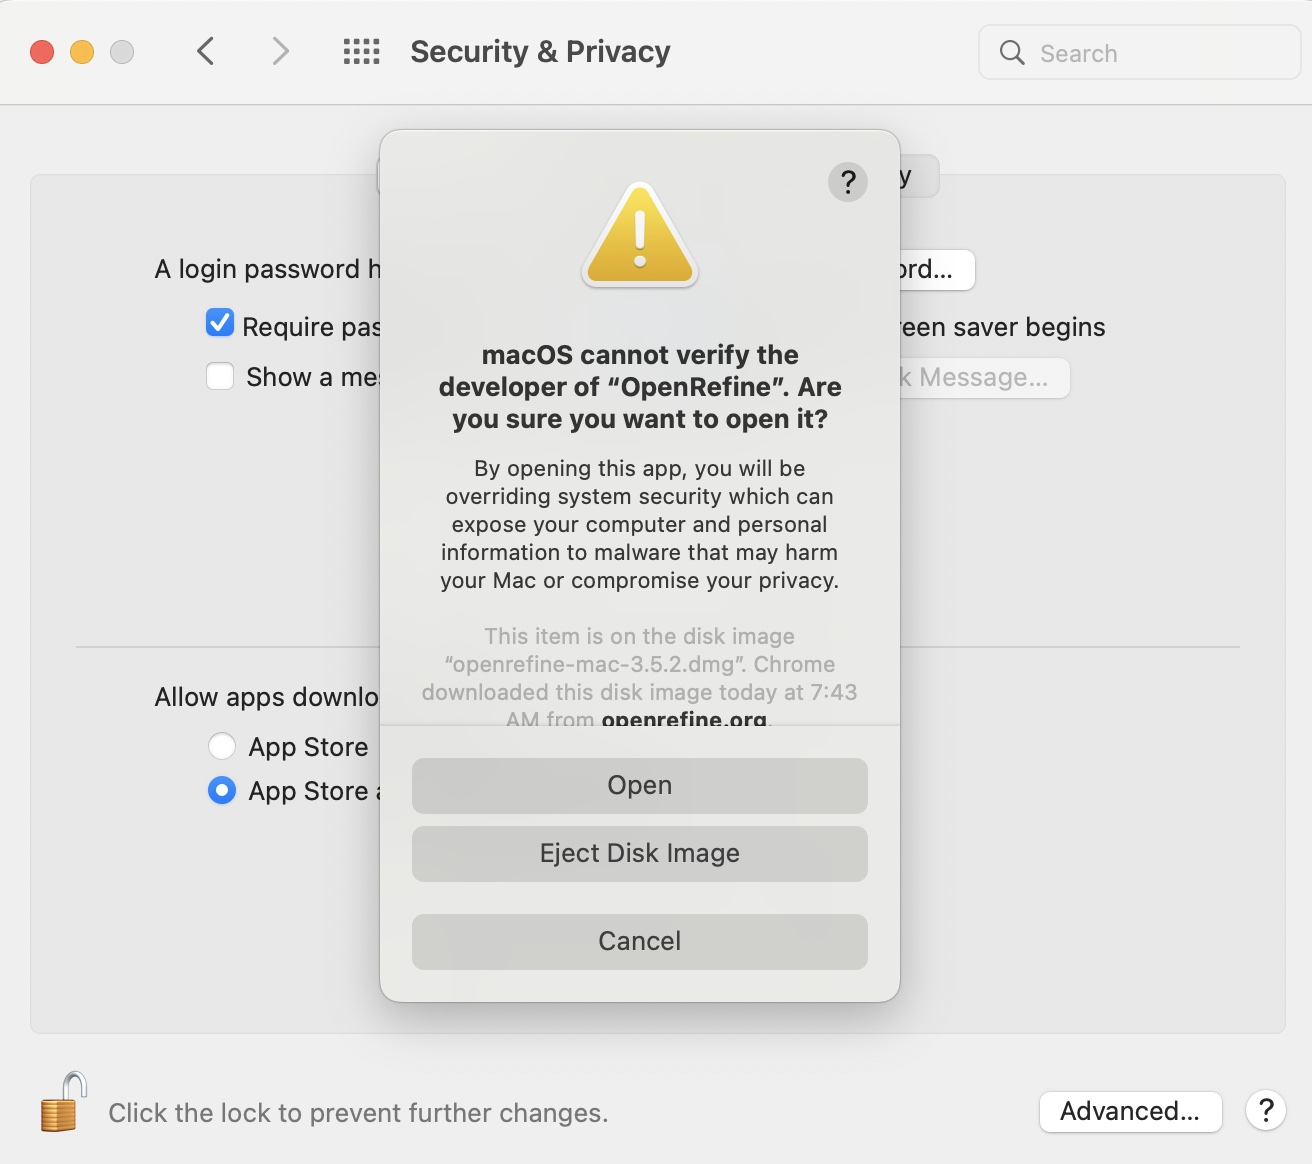
One you do, you will see something very similar to the warning you saw before…. except this time there is a new option “Open”. Go ahead and click “Open” to launch OpenRefine. In the future, it should launch normally with no warnings.
All Users – Running and Shutting Down OpenRefine
OpenRefine doesn’t run like some other applications you might have used on your local computer. It technically launches a local web server which you interact with through your browser. Don’t worry, this web server is only visible to you and is not on the internet.
What this means is that when you launch the program on say, Windows, a Command Prompt window will open with a bunch of text output (this is the web server running) and then your browser will open to the URL ‘http://127.0.0.1:3333/’. If you are on OSX you won’t get a terminal window but will see an icon for a running application in your Dock, and likewise your browser will open to ‘http://127.0.0.1:3333/’.
Now, if you close your browser window, you have closed your interface with OpenRefine, but haven’t actually shut the web server down. As long as OpenRefine is still running, you can open a new tab and navigate to ‘http://127.0.0.1:3333/’ to resume. To shut OpenRefine down you need to either (Windows) close the Command Prompt or (OSX) right-click the OpenRefine icon in the system Dock and choose “Quit.”
Getting Our Data
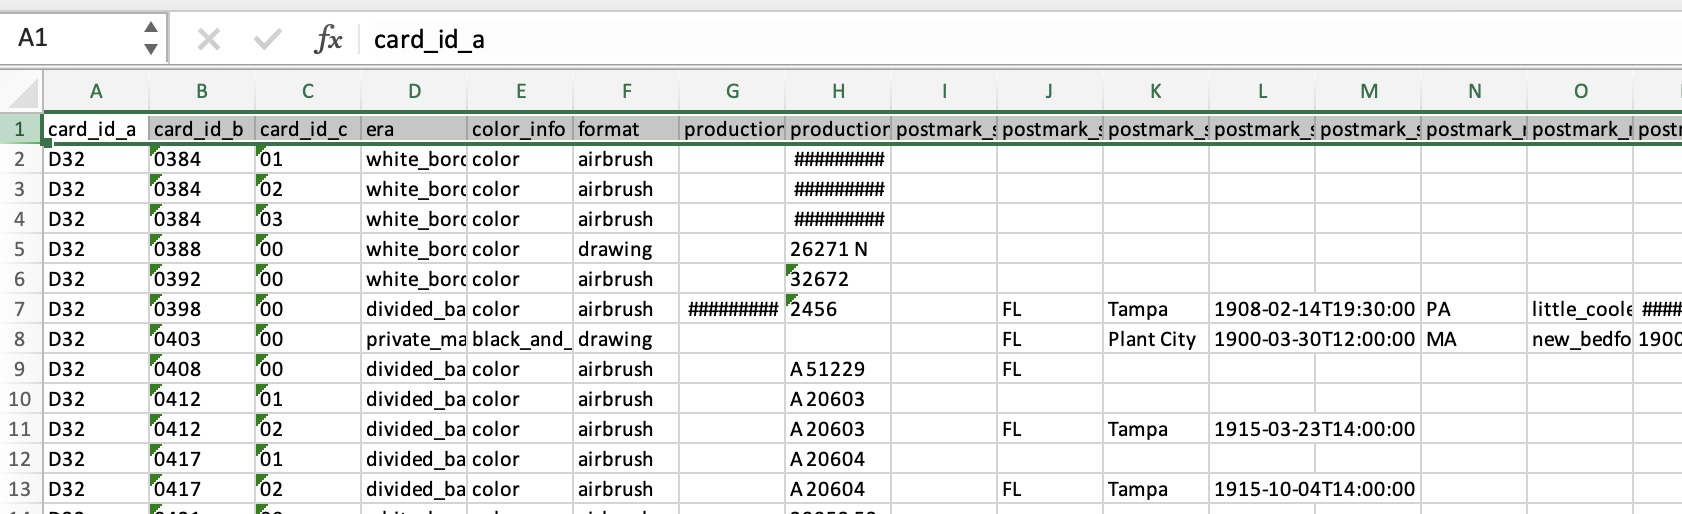
Our sample data today comes from a now-defunct project I once worked on, called The Florida Postcard Project. The aim was to digitize the collections of the USF library’s postcard collections, which includes tens of thousands of postcards, some of which date to the late 1800’s complete with text, drawings, and photographs of countless Florida historical landscapes. Our goal was to collect as much information as we could, about the cards themselves, their hand-written messages, but also the images, places, and text data represented in the cards. It was my job to design the data schema and controlled vocabulary… as you will see I met with less than total success. The data gathering process culminated in a single Excel file with multiple spreadsheets, a small excerpt of which we will use for training purposes here. There is one spreadsheet for information on the cards themselves, another for images found on the cards, another for locations, and so on. We aren’t going to fix everything in this exercise, but we will scrub data from more than one sheet.
But first, you need to get a copy of the data, download it here.
Scrubbing Our Data
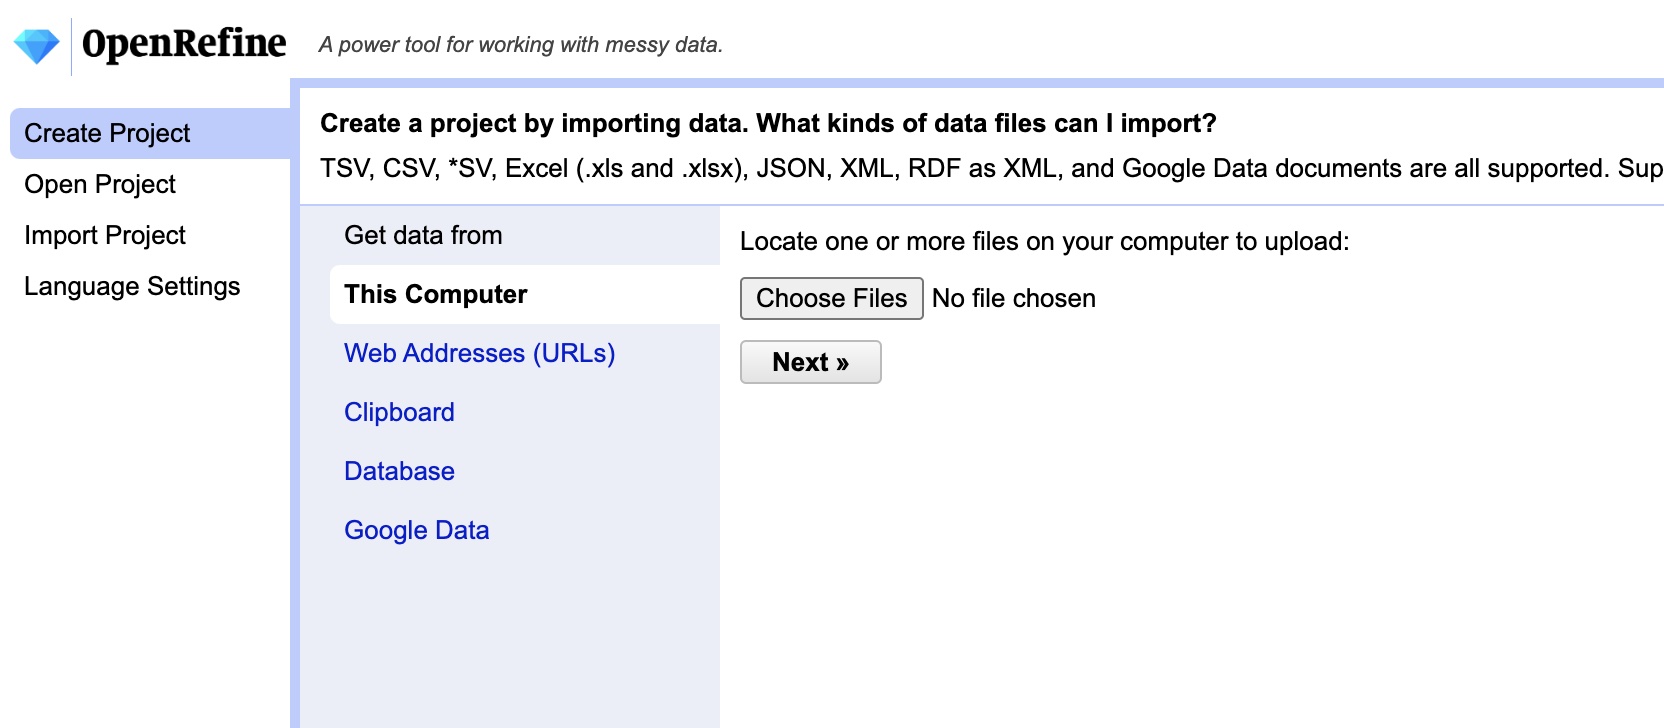
If you haven’t already, launch OpenRefine. Once it is started and your browser is open to ‘http://127.0.0.1:3333/’ click the “Choose Files” button. Now select the ‘fl_postcards.xlsx’ file you downloaded then click “Next.”
Now you should be taken to the file loading screen. We haven’t actually loaded the file yet, this is a preview of how OpenRefine will open and interpret the data. This gives us a chance to tweak settings and tell it which spreadsheet(s) we want to work with.
NOTE: You aren’t ever modifying the original file inside of OpenRefine… it imports the data from the file to a local copy that you work with. Your original data will be safe. To make the changes we will need to export the cleaned data from OpenRefine at the end.
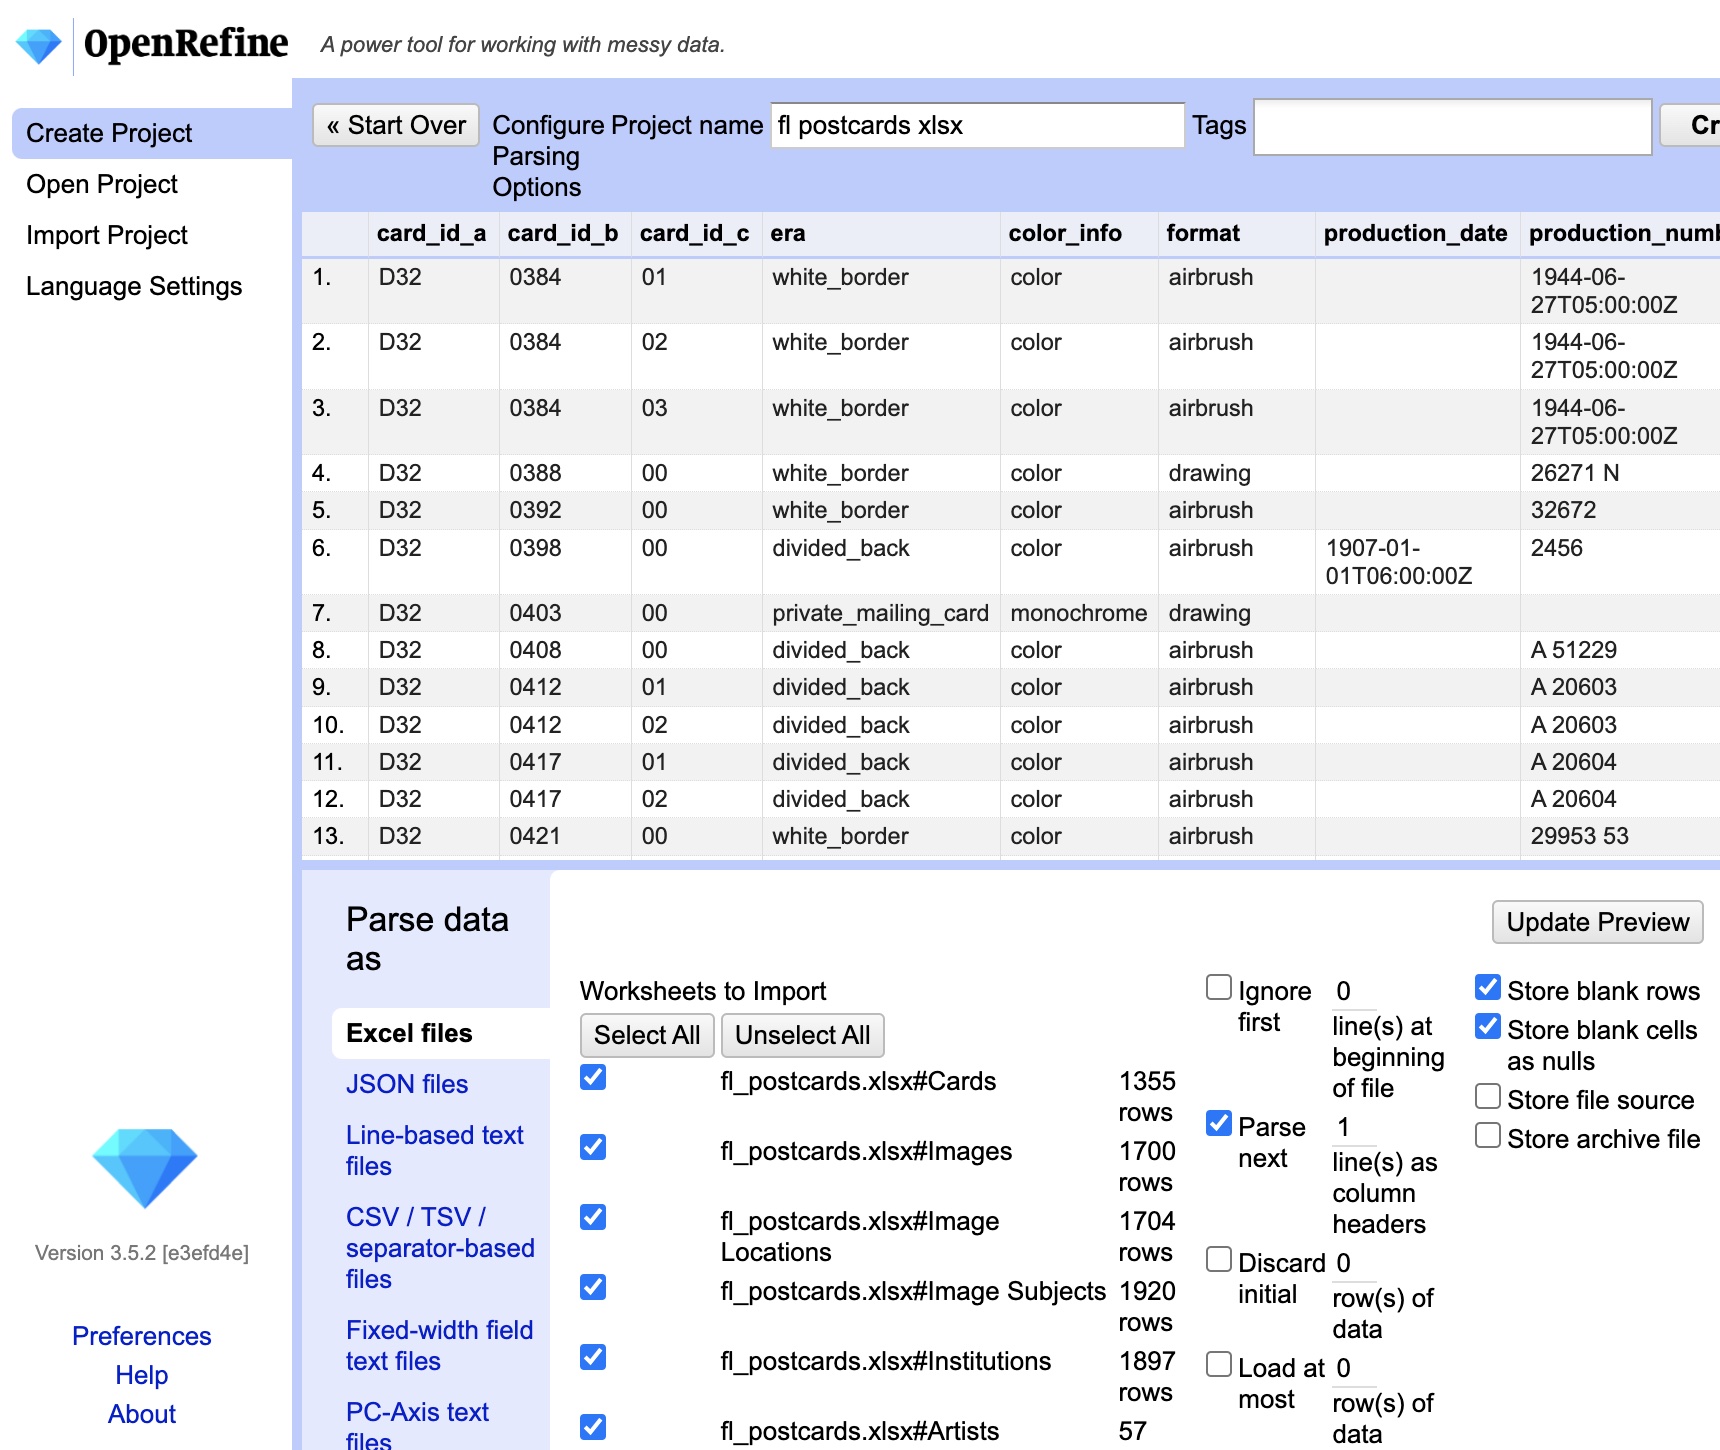
A few things to notice:
The top half of the frame shows a preview of what the data will look like if you import it with the current settings.
On the bottom left there is a pane titled “Parse data as”… here you can see that it has detected we are opening an Excel file, but if you were trying to open another file type, like a CSV, you could manually select that here.
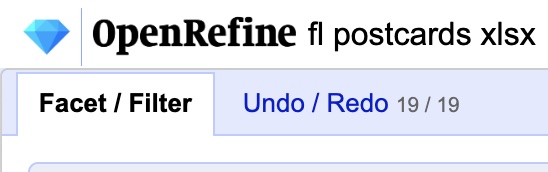
Just to the right of that you will see a list titled “Worksheets to Import”…. THIS IS CRITICAL you must unselect ALL EXCEPT “fl_postcards.xlsx#Cards” (that is, the Cards Table). If you don’t, OpenRefine will try to load all of these spreadsheets into a single file, basically merging them into a giant mutant spreadsheet with a million columns and zero sense. So, make sure you have only ONE table selected at a time.
All the other settings are fine… we could change them if we had to alter the way it read in column headers, but these settings are fine for most situations including this one. So, let’s get started and click the “Create Project” button in the top right corner. After a few seconds you should see an image like the one below.
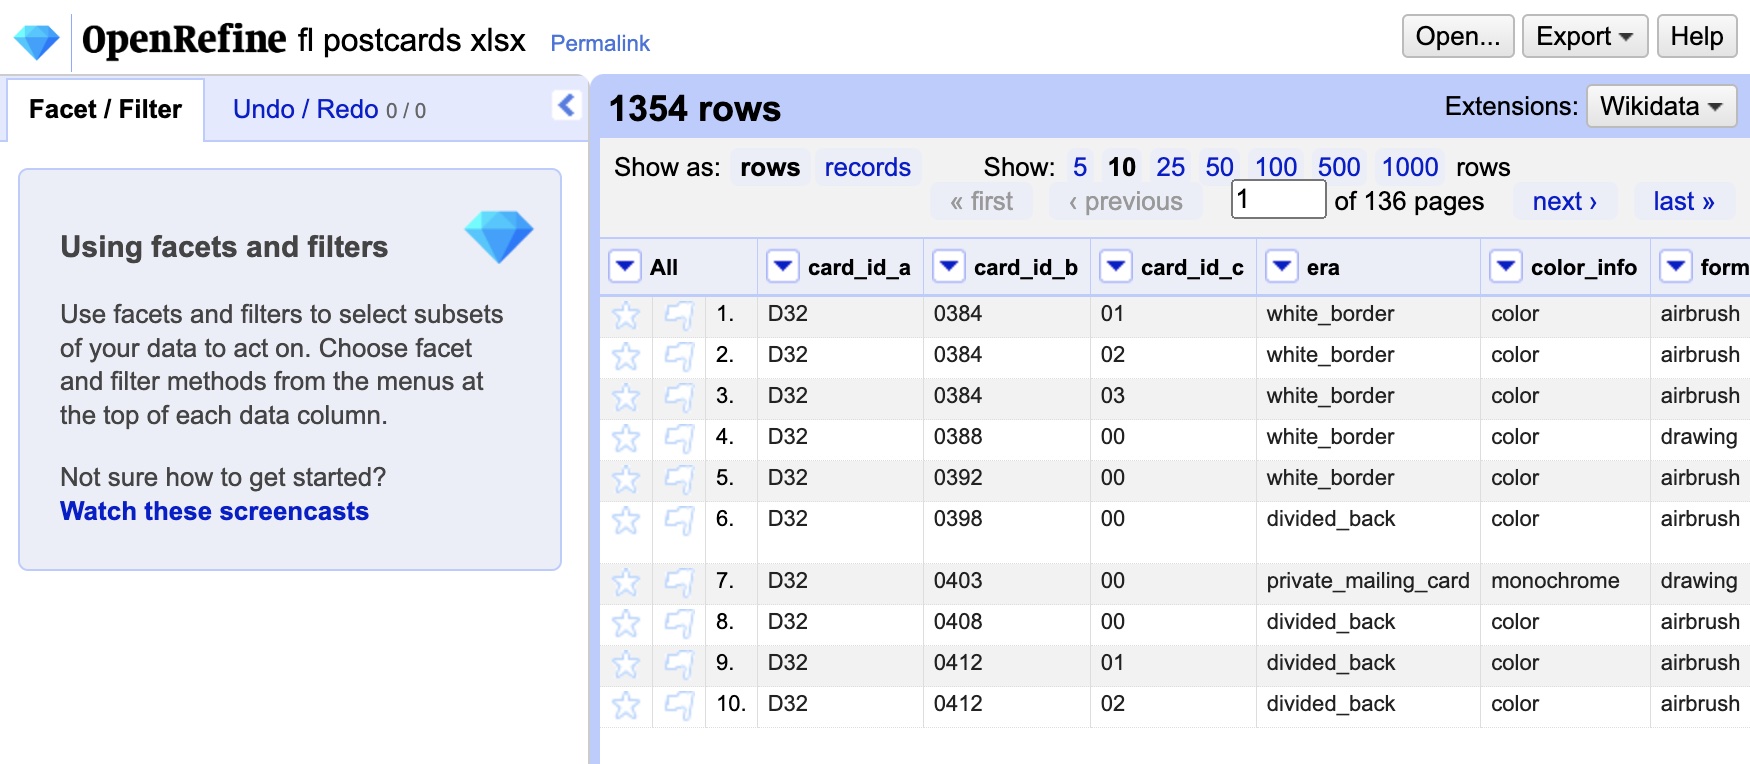
On the left side of the window is the Facet/Filter panel, where we will eventually perform many of our data operations. On the right side is a view of the data itself. You may notice that you aren’t seeing all the data, by default it only shows you the first 10 rows. You can increase that number or manually page through the data. In addition, each column has a drop-down menu indicated by a down arrow. These menus will be our primary way of choosing which facets and filters to apply to our data.
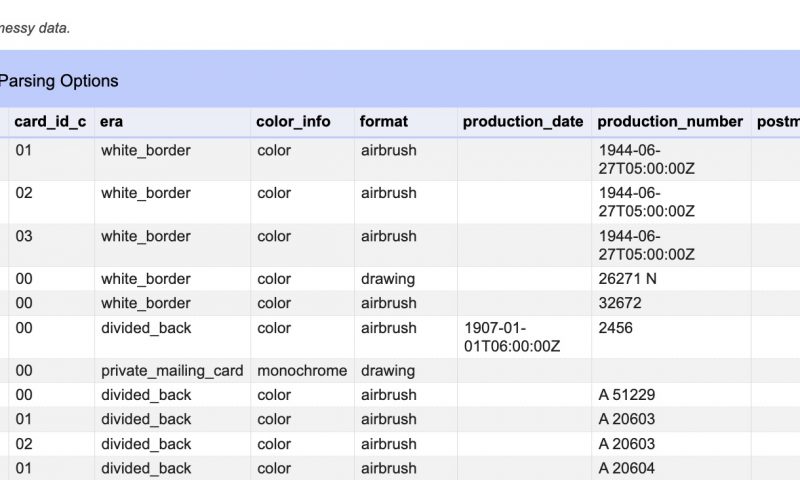
So let’s dive in! I happen to know there are mistakes in the “era” column, and one of the best ways to suss this out is to use a filter. In our case (and for the Humanities in most cases) the filter we want is a text facet, since we are dealing with text data. Text facets allow us to quickly see all unique entries and sift through variants. To choose a text facet, click the drop-down menu on the “era” column, then choose “Facets”, then “Text facet”.
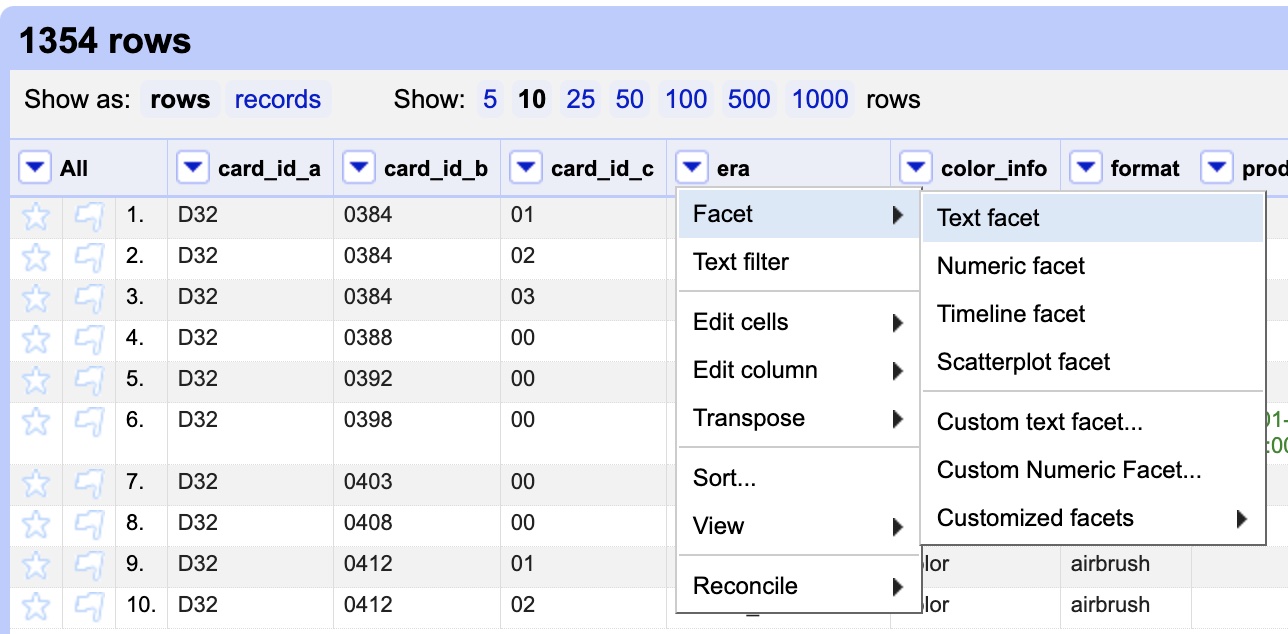
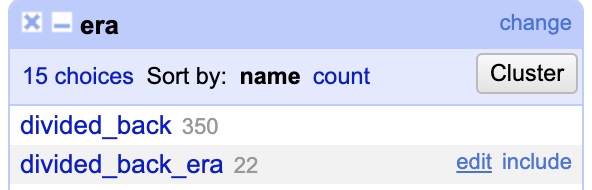
Now, on the left side of the window you should see the text facet open and it should look like this…
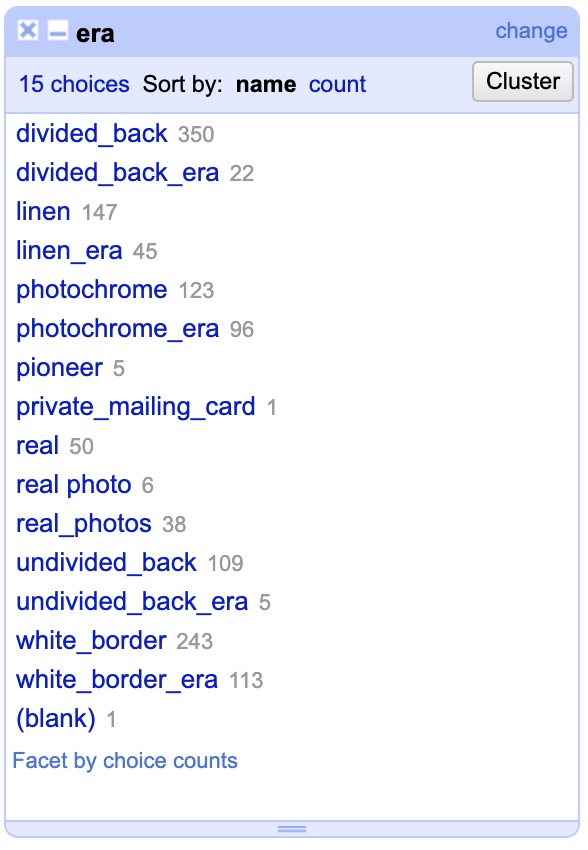
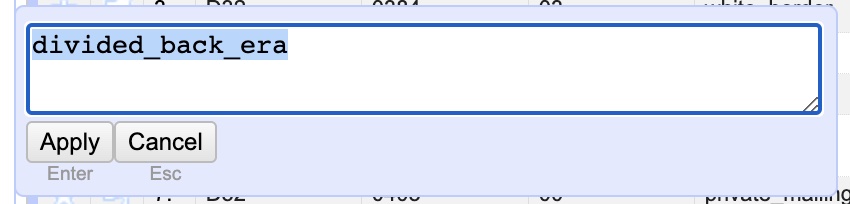
What you are seeing is a list of every different variation anyone ever entered in the “era” column, along with a total count of the amount of times that variation appeared. In other words: 350 different records have “divided_back” as their entry while 22 have “divided_back_era”. Clearly you can see we’ve already spotted an issue, these should both be the same and just say “divided_back”. Looking down the list you can see that this has happened a few times. Fortunately, text faceting makes this a cinch! To fix it hover your mouse over the line for “divided_back_era” and then click the “edit” link that pops up to the right when you hover. Now, simply delete the “_era” portion in the pop up panel leaving only “divided_back” and hit “Apply” to instantly change every record! With that, you changed 22 rows at the same time.
To clean up the rest of the column it’s a simple rinse and repeat. Remove the “_era” from “linen_era”, “photochrome_era”, “undivided_back_era”, and “white_border_era”. While we are at it, we can see that there are three variations, “real”, “real photo”, and “real_photos”. In this case literally everyone got it wrong as it should be “real_photo”. Make the edit to all three to change them to “real_photo”.
With that, we’ve already cleaned up one column! You can imagine that if we were trying to make a bar chart visual of the different types of postcards it would have been hopelessly confusing before this fix! Now our data is clean and neat.
While we are at it, I wanted to point out another feature of “facets.” In addition to editing all entries of a given variation, it also allows you to quickly view and filter the data applying to only those entries. If you hover your mouse over “divided back” you will see next to “edit” it says “include”. If you click that, only entries matching that variation will appear in the data view and any data operations you perform will ONLY affect that data. This can be a super powerful way of selectively applying transformations to only portions of your data. We won’t really be messing with “include” further in this tutorial, but I wanted to make you aware. If you hit “include”, you can simply hit “exclude” to return to normal.
I’d also point out that there are other kinds of facets, like numeric and date/time facets that work with other kinds of data. We aren’t going to work with those today, but it’s good to know OpenRefine has the power.
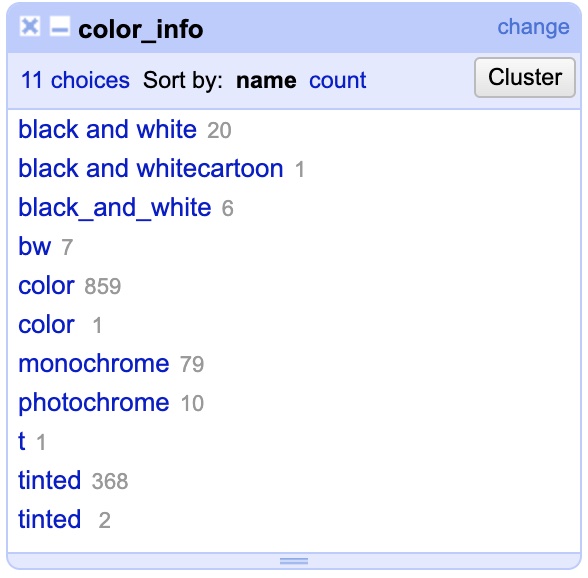
Now that we’ve gotten the “era” column cleaned up, let’s take a look at the “color_info” column. Click the drop-down menu on the column, choose “Facets” and then “Text facet”. When it opens you should see something like this…
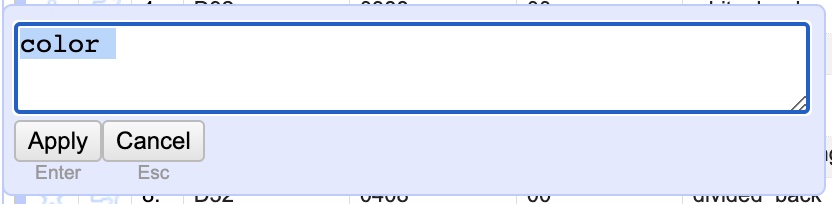
To get started there are some obvious corrections. “black and white”, “black and whitecartoon”, “black_and_white”, “bw”, and “monochrome” should ALL be “black_and_white”. Once again, this demonstrates the extreme diversity one encounters in data entry. In addition, change “photochrome” to “color” and “t” to “tinted.”
We are close, but now we are left with two oddities. There are two entries for “color” and two for “tinted”, seemingly identical. Close… but not quite. If you edit the second entry for either “color” or “tinted” you will see that it actually has a trailing whitespace. That is, it is actually “color ” instead of just “color”. While almost invisible to the human eye that distinction makes it a wholly different thing to a computer. This is a SUPER common error as it is so easy to accidentally hit a space during data entry and nearly impossible to see.
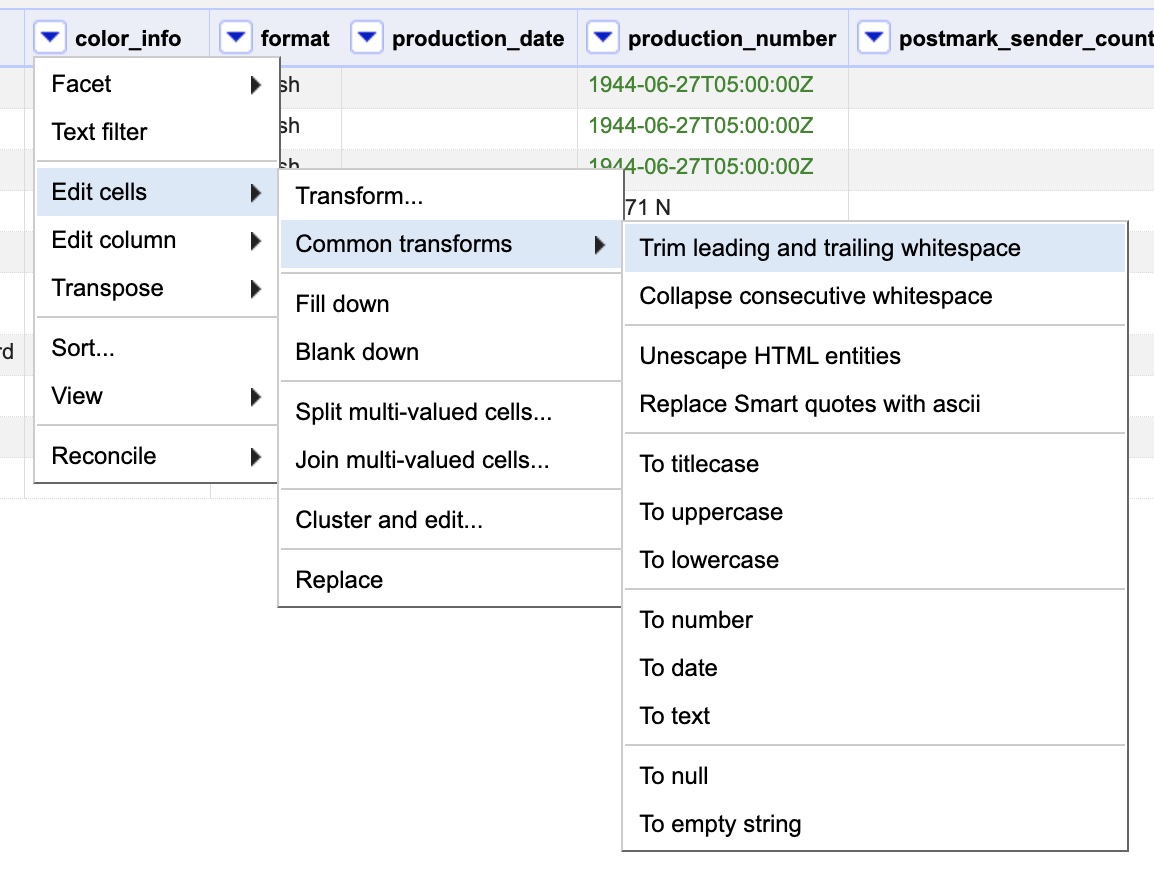
To fix this we COULD manually delete the whitespaces like we did before. BUT, there is a much more efficient and powerful way to automatically take care of whitespaces for you and showcases some of the other powers OpenRefine has. It’s easy to use, just click the drop-down menu on the “color_info” column and choose “Edit cells” and then “Common transformations” and finally select “Trim leading and trailing whitespace”. This automatically takes care of any spaces at the beginning or ends. Once you run it you should see we only have three remaining variants on the left “black_and_white”, “color”, and “tinted.”
If you’d like, go ahead and apply what you just learned to try and clean up the “format” column using both the text facet and trimming of leading and trailing whitespaces. Once you are done (or skipped), let’s move on to some new problems with the “postmark_sender_city” column. Click the drop-down menu for the column and open a text facet.
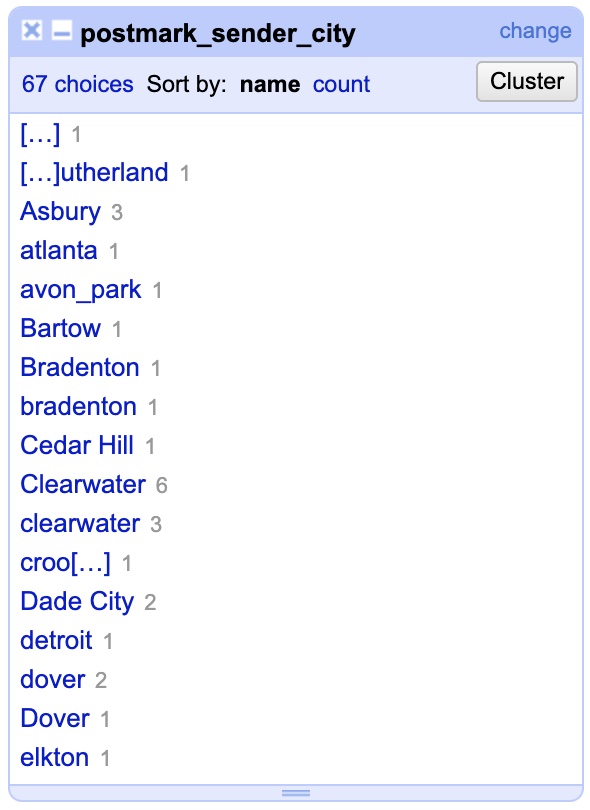
Okay, we’ve got a problem of a new scale here…. you can see we have variations not so much in terminology but in capitalization. Moreover, unlike before there aren’t just a few variants to fix but many. In fact, if this wasn’t an abridged portion of data the number of cities to fix would be much greater. So, how can we fix this quickly? Using another common transformation like we did to get rid of trailing whitespace. Click the drop-down menu for the column, go to “Edit cells” then “Common transformations” and then choose “To Titlecase” which will capitalize the first letter of every word (note: it annoyingly does this to word sometimes not capitalized like ‘of’ and ‘the’ so its not perfect).
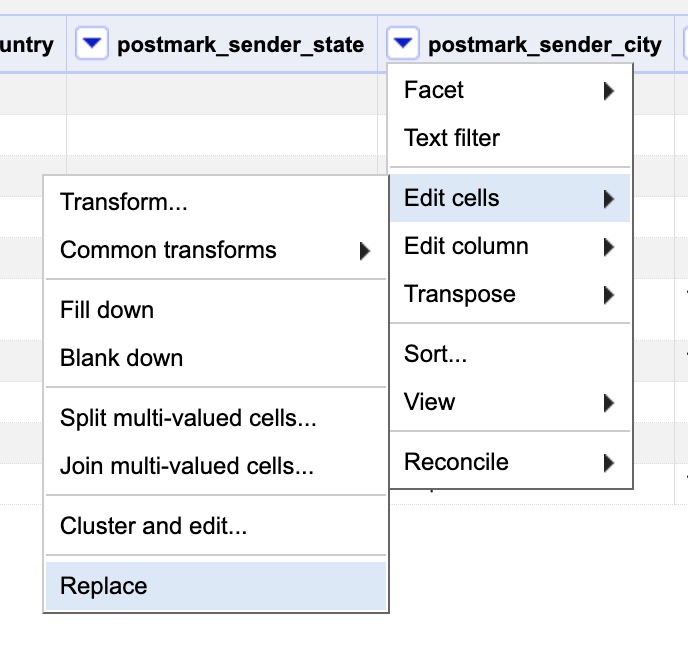
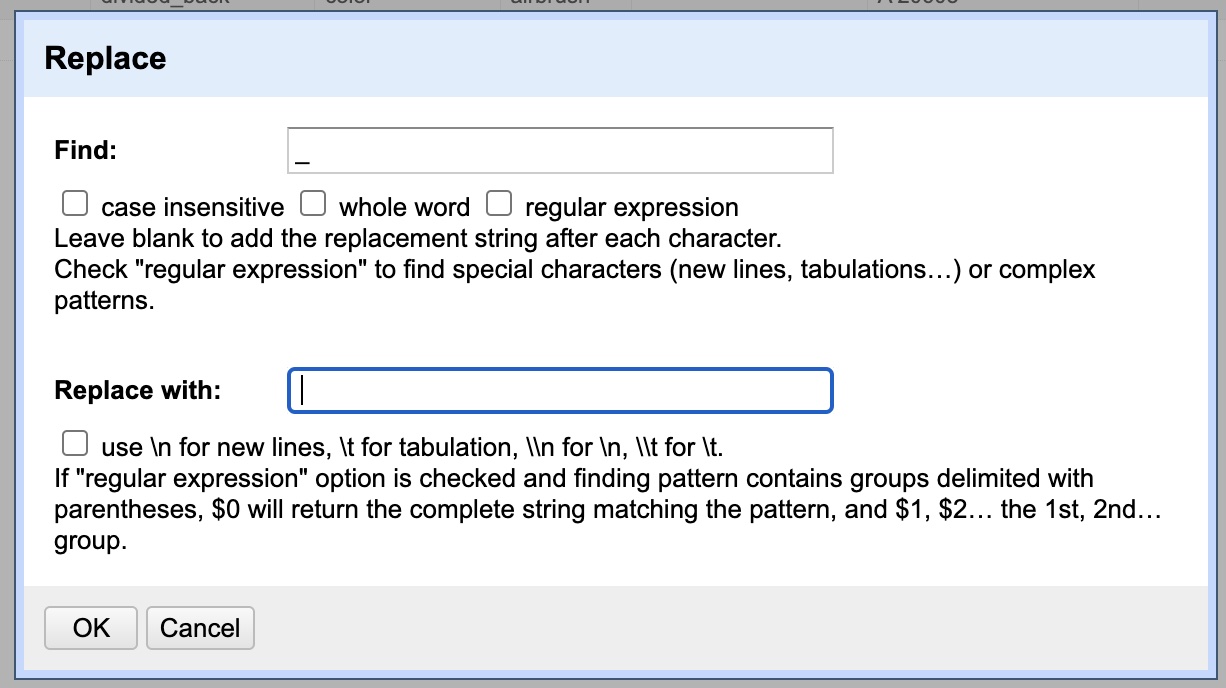
You should see the results improved in the text facet on the left side of the window. As we can see, there are still some oddities. One of them is that some individual(s) recorded city names using underscores “_” instead of spaces. Rather than editing them all one by one in the text facet, we are going to run a “Replace” function. To do so, click the column’s drop-down menu, go to “Edit cells” then chose “Replace.”
Once the dialog box opens up, enter “_” under the “Find” field and under “Replace” enter ” “. This will replace all underscores with spaces. All other options are already as we need, but it’s not a bad idea to realize that case sensitivity or whole word matching might be useful in other occasions. Hit “Ok” to perform the fix.
Great, you should see the changes update in the text facet, e.g. “Avon_park” becomes “Avon park”. But that highlights a new problem. Now that we introduced spaces we can see that the second word is not capitalized because it was skipped in our earlier operation. This is an easy fix, just run the “To titlecase” transformation on the column again under the “Common transformations” submenu inside the “Edit cells” menu.
Skimming down the variations in the text facet on the left we can see that we almost have it. We can just manually change the couple remaining issues like changing “Fernandina Bch.” to “Fernandina Beach”, or “St. Petersvurg” to “St. Petersburg”, or “T” to “Tampa”, or “Ybor City, Tampa” to just “Ybor City”. There is another way to streamline editing these locations which we will get to in a just a second on the next data sheet.
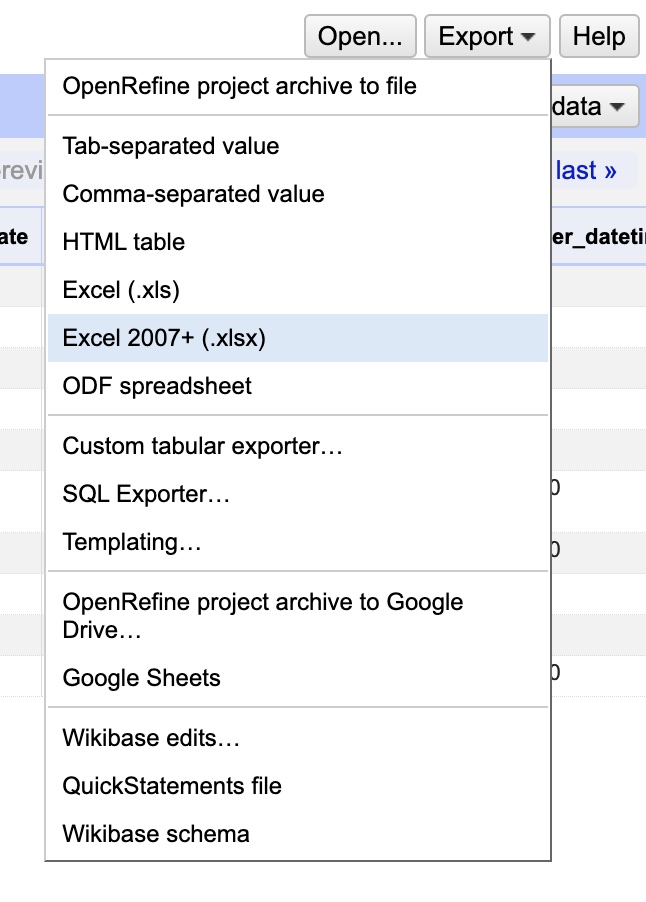
For now, celebrate! You’ve just cleaned your first data sheet, the “Cards” spreadsheet is pretty much fixed and is ready for export. Remember: OpenRefine has been working with an internal copy of your data it imported. It has NOT changed or altered your original Excel file. To do that we need to export the data from OpenRefine. So, click the “Export” button at the top right of the window and choose “Excel 2007+ (.xlsx)”.
Now you should have downloaded a new Excel workbook, you are almost there. Open the workbook and you will see it only contains one spreadsheet, the one we edited (cards). Now you want to select all data, to do that click on the row number just to the left of the header (it says “1”). Then, scroll down to the very last row of data, hold down the SHIFT key and click the row number just to the left of the last row (it should say “1355”. This will select all the data from these rows. Now COPY the data (CTRL+C on Windows, CMD+C on OSX) into the clipboard.
Now, open up the original Excel workbook you downloaded (fl postcards.xlsx) and make sure you are on the “Cards” spreadsheet (change spreadsheets by tabs at the bottom of the window). Then, simply “Select All” data by pressing CTRL + A (Windows) or CMD + A (OSX). Now that you have all the data selected, replace it by pasting (CTRL + V for Windows or CMD + V for OSX). Then just save the file and bang, changes made!
That covers a lot of the basics of OpenRefine and you could stop here. But to check out some of OpenRefine’s power and get a sense of its potential, let’s fix one more column on a different spreadsheet.
To do this, we need to make a NEW project. We need to reimport from the original file again since this time we want to work with a different spreadsheet. To get out of our current project and back to the main menu, click the OpenRefine icon at the very top left of the web site, or just manually navigate to ‘http://127.0.0.1:3333’.
You should be back under a new “Create Project” page. If not, click “Create Project” on the left hand frame. Now, click “Choose Files” as you did before and again select “fl postcards.xlsx”. When the data preview loads, let’s change the name of the project by altering it in the field near the top right. Set it to “fl postcards – image locations”. This will help us distinguish it from our earlier data import if we need to get back to it. Finally, under “Worksheets to import” unselect everything but “fl_postcards.xlsx#Image Locations”. Hit “Create Project” to finish importing and start working with the data.
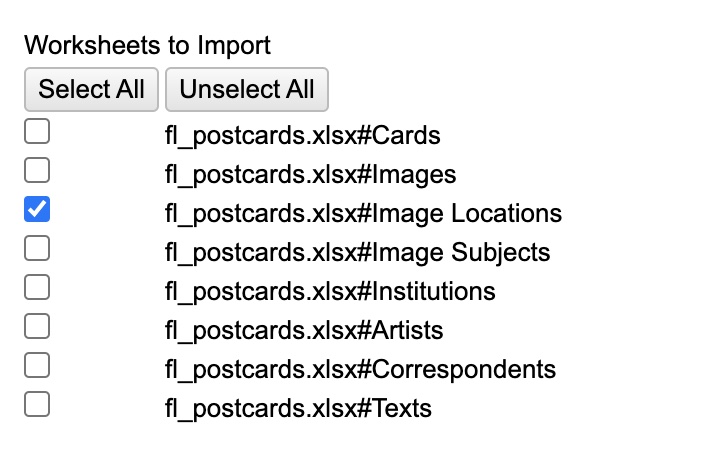
Now that it has loaded you can see this worksheet contains a description of a location found in an image, along with the city, county, and latitude & longitude data. We could poke at the city field, but for our purposes today, we will restrict ourselves to the “description” column. Click the drop-down menu and open a text facet to see the depth of the issue.
You can immediately see that trying to fix all the variants manually inside the text facet would still be a huge pain. There are 532 different variations, and this is just the abridged data set. The full set would include tens of thousands. This is because unlike other fields, this one is more open-ended. One cannot enforce a limited set of say, 10 terms, for a description. At the same time, some order would be nice, and things describing the same places should be described in the same manner. Fortunately, OpenRefine has a way to detect and group together similar entries.
To do this, click “description”‘s drop-down menu, then choose “Edit cells”, then “Cluster & Edit”.
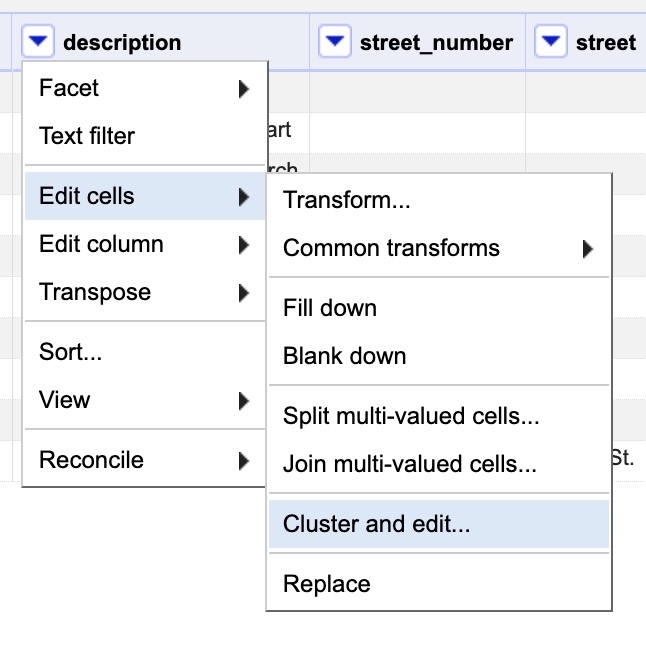
This will open the Cluster and edit dialog box as seen below.
What you are seeing is a list of groupings of similar entries. You can see the variations for a given group under the “Values in Cluster” column, and can see what value they will all be changed to under the “New Cell Value” column. Note that by default, NONE are selected to “merge”, meaning they won’t change. If you want to approve a change you MUST first click the box under the “Merge?” column. If you want to change it to something other than its default, change the value on the right.
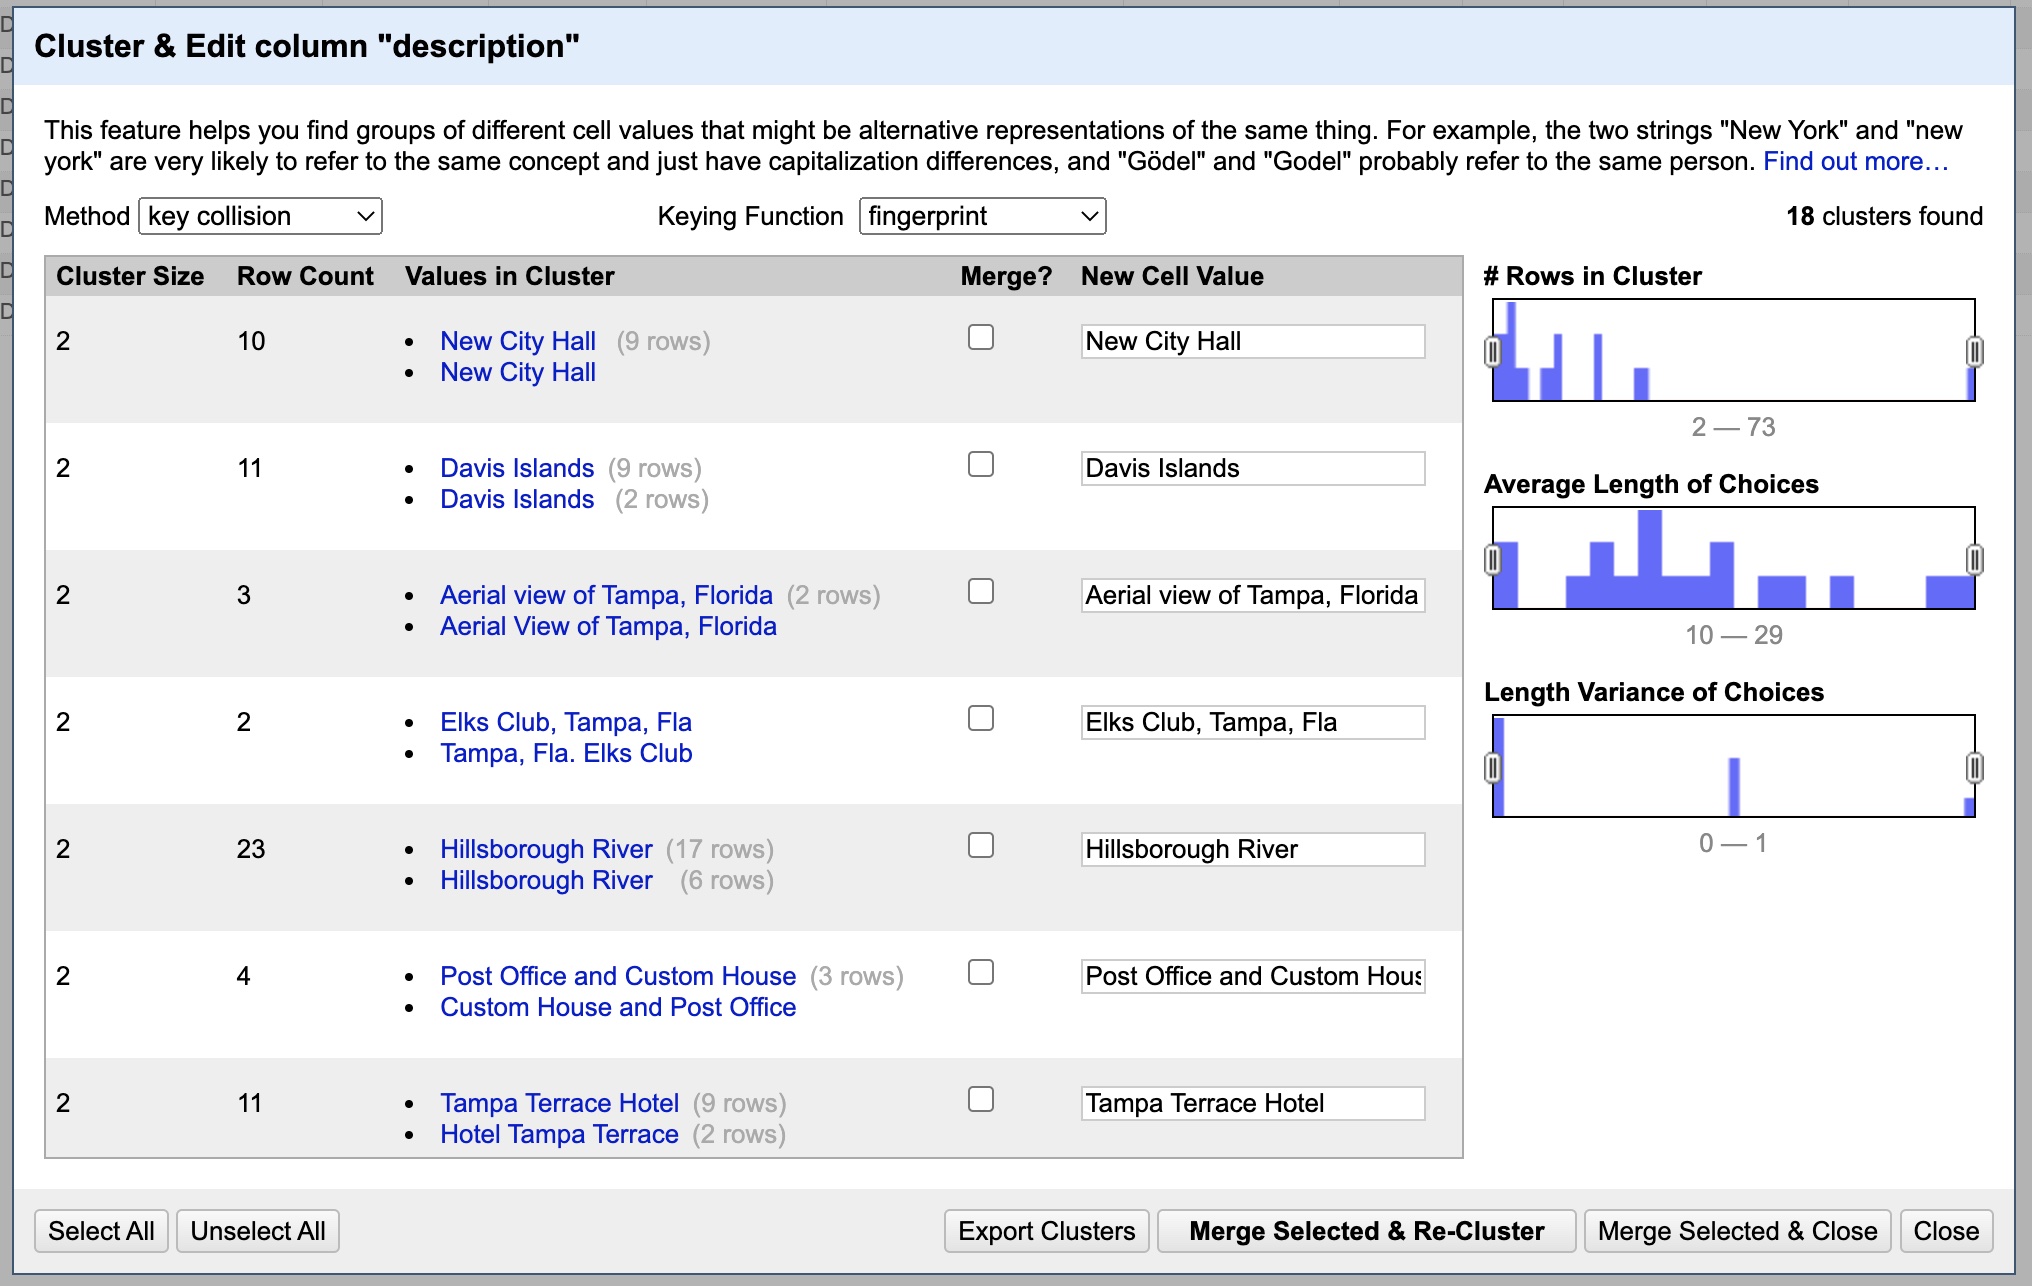
Looking down the list, every catch looks like a valid one. Since we will want to change them all we can just hit “Select All” at the bottom left. DON’T DO THIS BLINDLY: OpenRefine will sometimes group unrelated things so always check before selecting all. For now all the values it wants to change them to are also fine, so click “Merge Selected & Re-Cluster”. This will perform the changes and then CHECK AGAIN for any new similarities found after the change.
It should say “No clusters were found with the selected method” at this point. That is great, but we can use other methods and functions to find more similarities. First, let’s click the dropdown menu for “Keying Function” and change it from “fingerprint” to “n-gram fingerprint”.
Again we want to change all so hit “Select All”. But, we want to change one of the “New Cell Value”s. In the first group, change “Palmaceia Springs” to “Palma Ceia Springs”. Now hit “Merge Selected & Re-Cluster.”
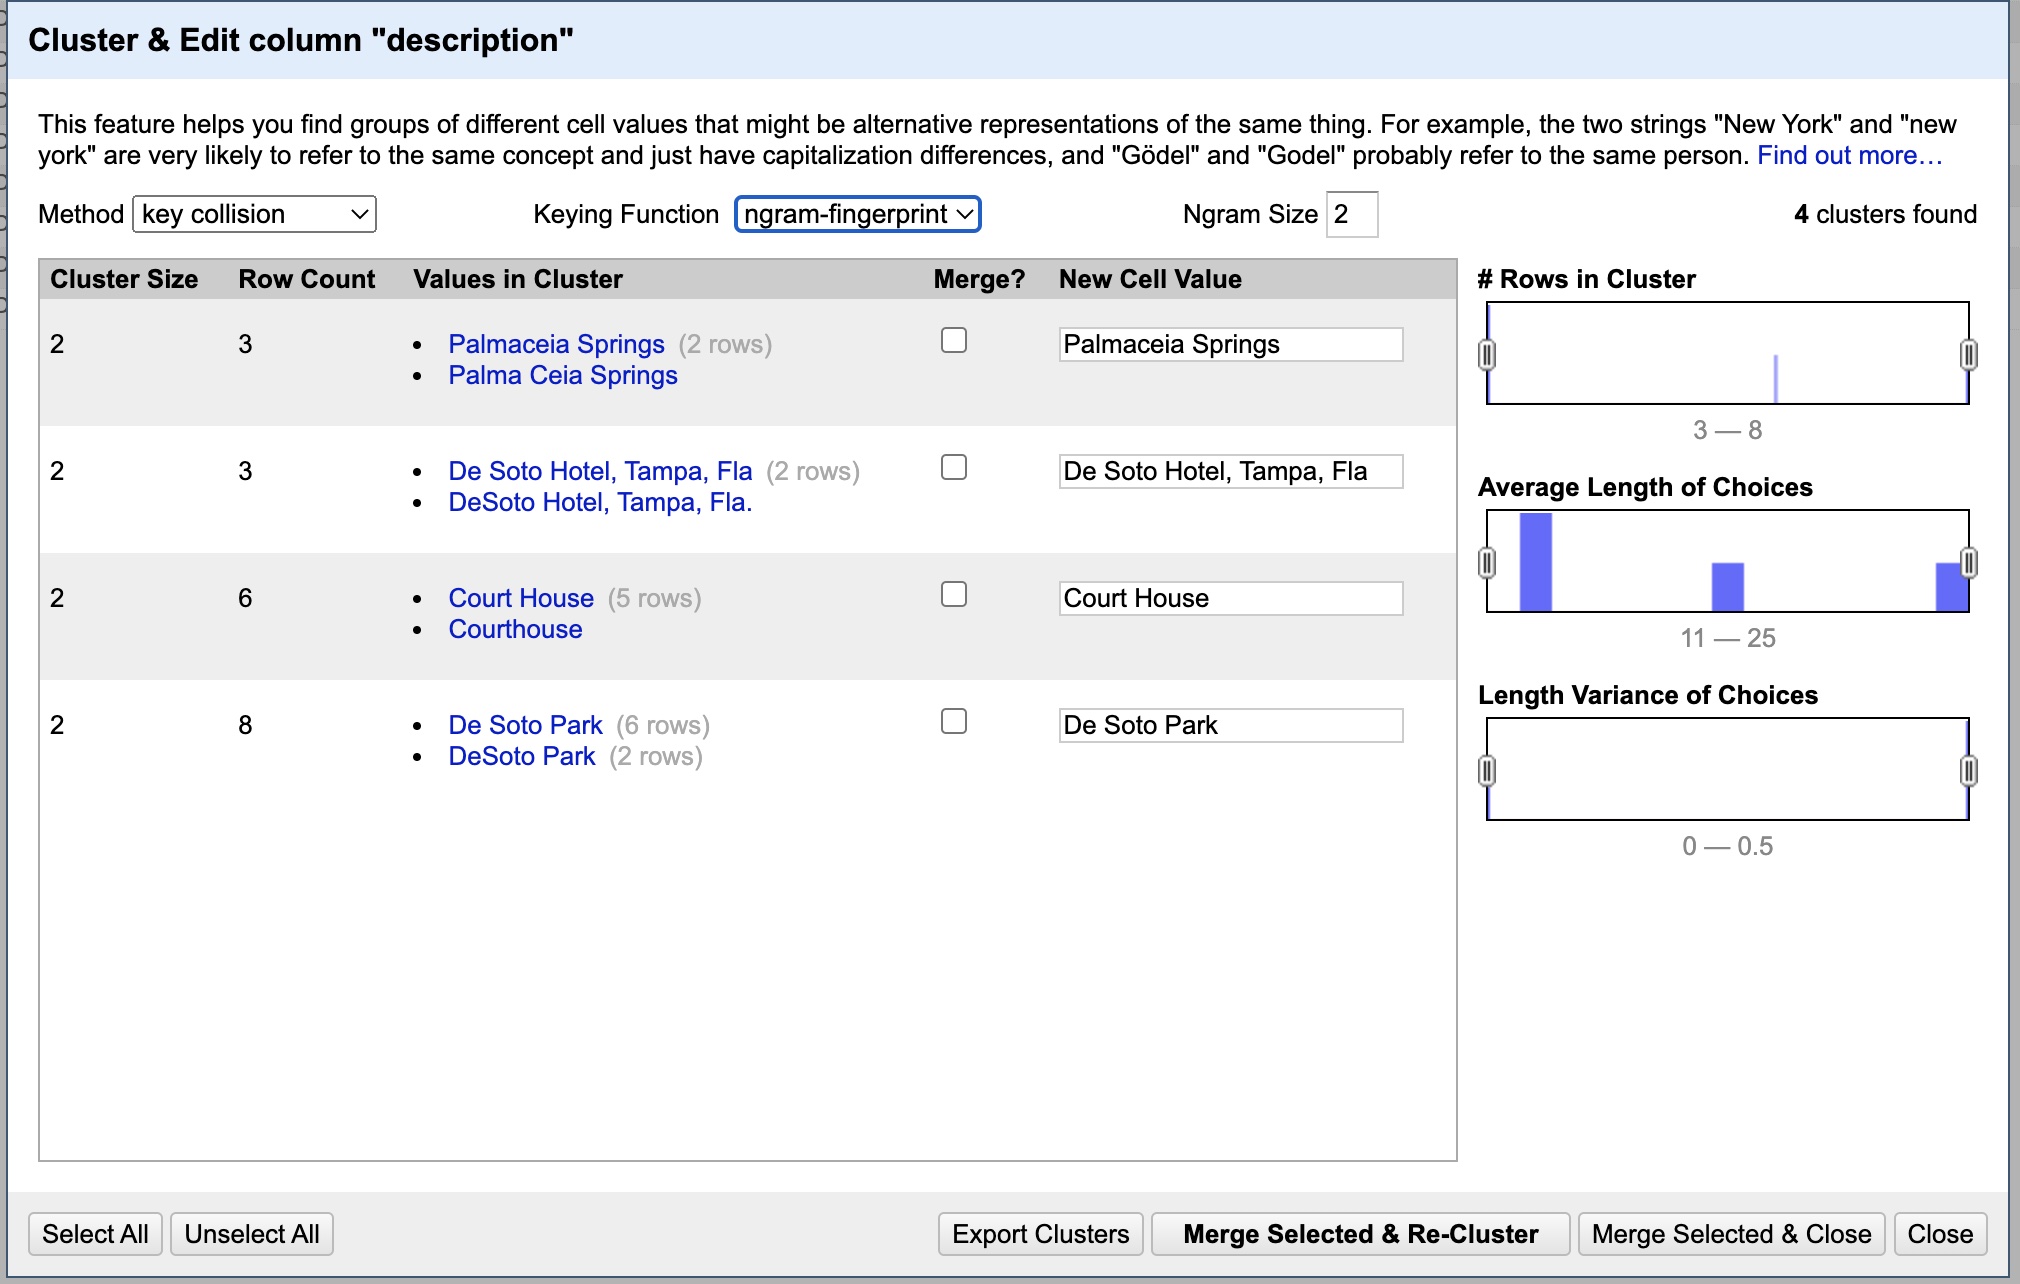
Again you should have no new results. You could try playing with the n-gram size (which is how many words it should scan in each direction when looking for similarities), but in this case it will make no difference. Let’s try another Keying Function, this time setting it to “metaphone3”. This one can both be cool but also produce a lot of spurious results. Rather than scan for similarities in the characters it scans for similarities in the way the words sound. Which can both find many new things but also give a lot of false positives, as you can see below.
Being much more careful this time we can see that most entries shouldn’t be changed. Still, we can select merge under the entries for “Citizens Bank” (change to Citizens Bank & Trust Co. Building). We can also merge “Gasparilla Parade”, “Las Novedades Restaurant”, “Officer’s Club at McDill…”, “The Tampa Theatre” (change to Theater), “Sacred Heart Church Altar”, “Tampa Post Office and Custom House”, “News Tribune Building”, “Tampa Yacht and Country Club”, “HAVATAMPA Cigar Company” (change to Have-a Tampa Cigar Company), “Aerial View of Tampa”, “Forest Hills Country Club”, “Bayshore Boulevard”, “City Hall and Tampa Bay Hotel”, “Tampa Theater”, “Rock Point Golf Club”, “First Presbyterian Church”, “Florida State Fairgrounds”, “First Church of Christ…”, “Fort Homer W. Hesterly”, “Hillsboro Hotel” (change to Hillsborough), “Exterior of Sacred Heart…” and “Woodrow Wilson Junion High School” (change to Woodrow Wilson Junior High School). Now “Merge Selected & Re-Cluster”.
At this point you get the idea. You can rotate through the rest of the keying functions, trying them out to find and merge similar entries. Once you have exhausted all the different keying functions, we can change the method used. To do that, go to the “Method” drop-down menu to the left of where you set the keying function and change it from “key collision” to “nearest neighbor”.
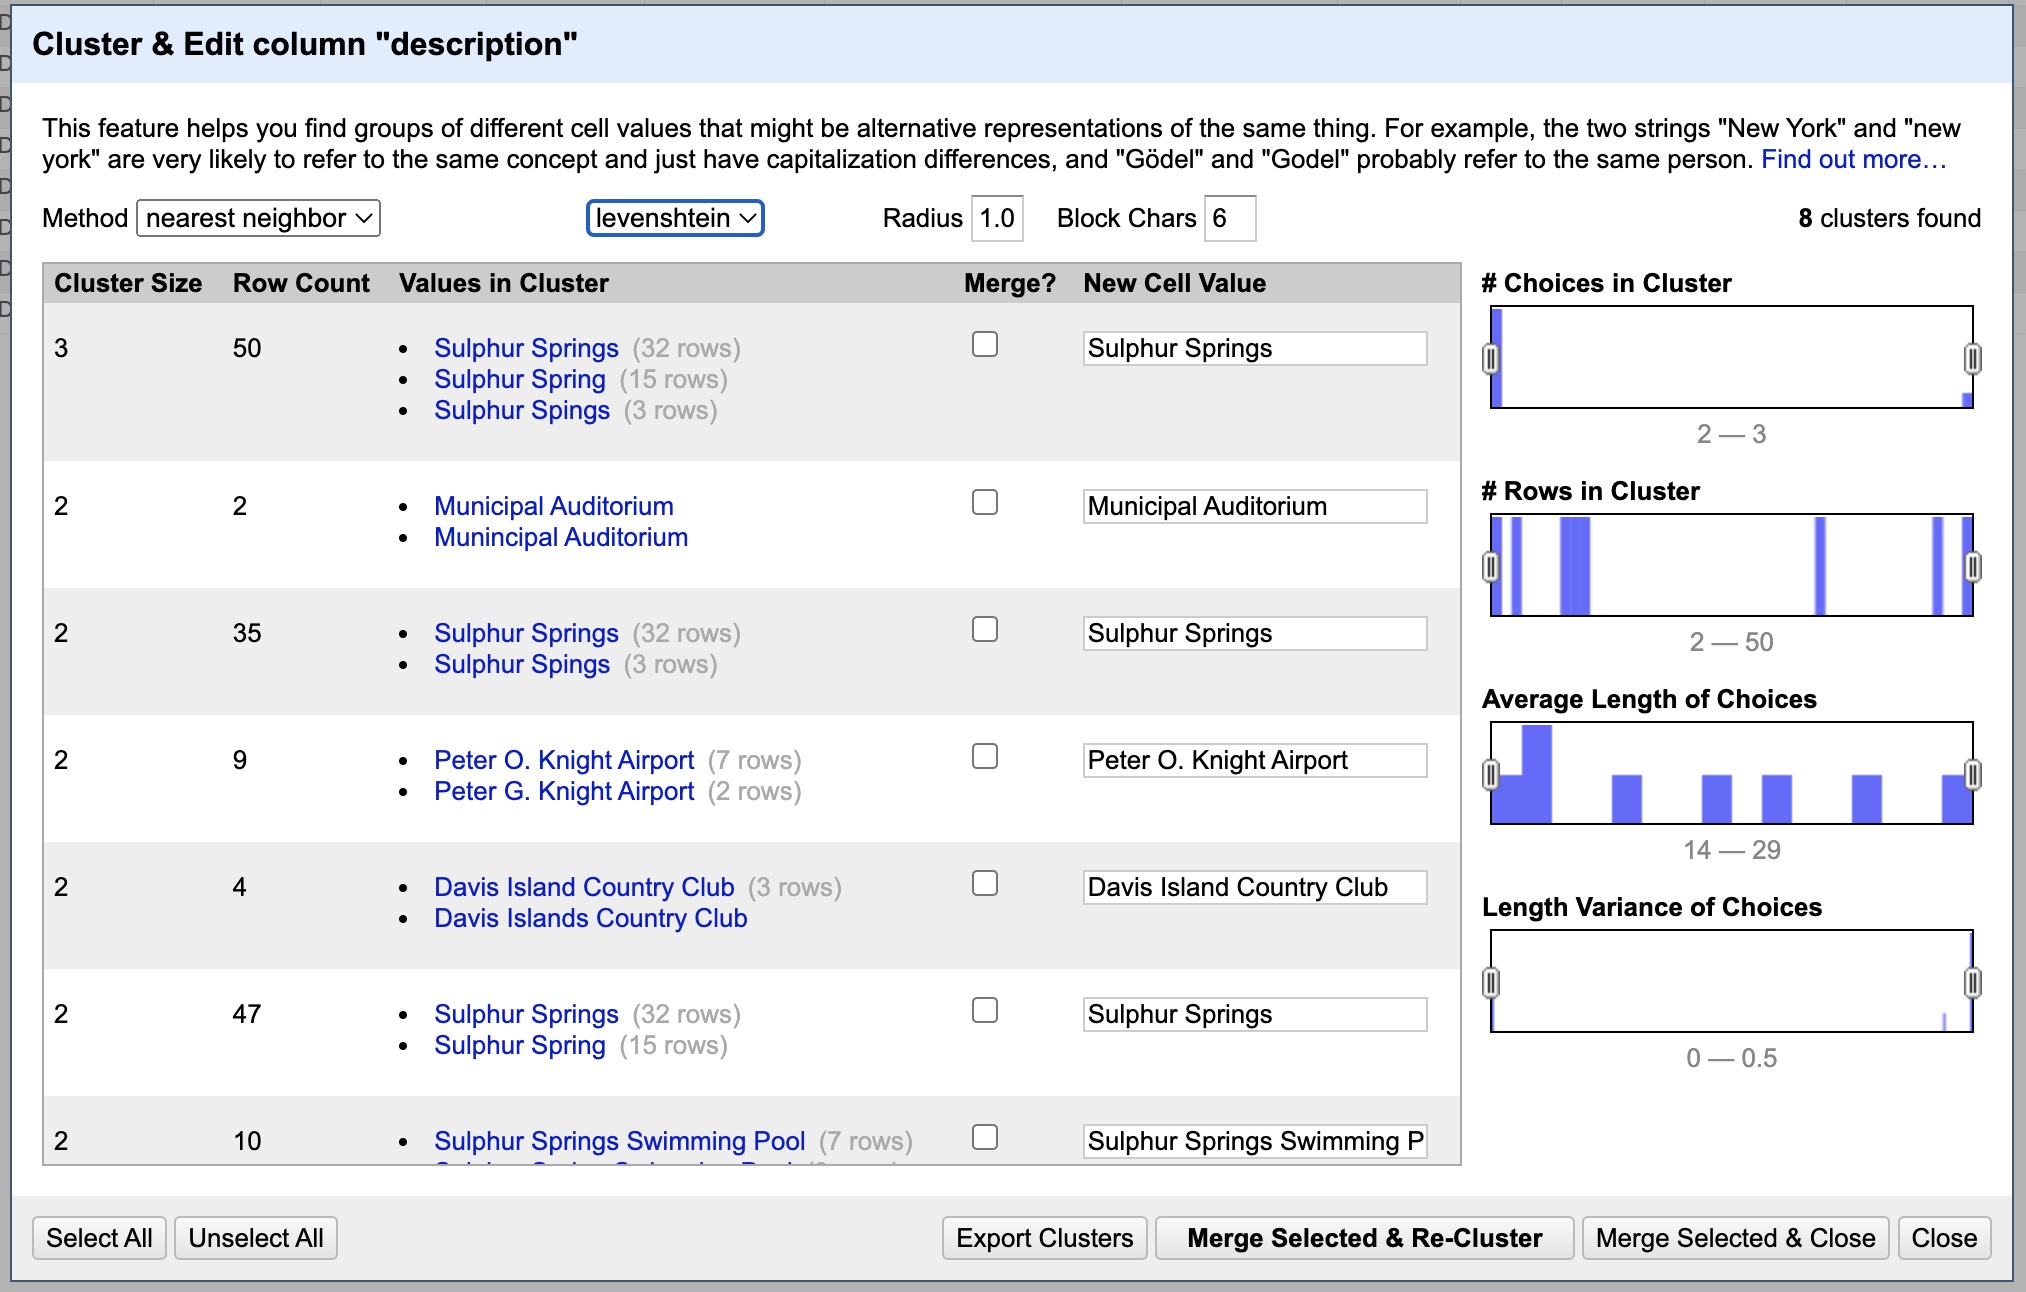
As you can see, it has discovered yet more similarities to comb through. You can make changes as before, at your discretion. Note that you can change options like Radius and Block Chars to potentially discover other results. Once you have made your merges, there is just one last option to check. Click the drop-down menu labeled “levenshtein” and change it to “ppm”. This is just another variation in the way it tries to detect similarities. If it found any relevant similarities, merge them. Finally, you can close this dialog box.
And that’s it for this tutorial! Remember to get the data out from this sheet you will have to repeat the process we did above of exporting the data (from the button at the top-right), opening it in Excel, copying all the rows, and pasting it into the CORRECT (read: Image Locations) table. Save the Excel file and presto Bob’s your uncle.
Now you can get started visualizing the data in programs like Excel, or better yet, Tableau. I hope you see the immense time that this program can save you. This is only the tip of the iceberg when it comes to features. And if you need truly powerful data edits (doing things like scanning/editing data across multiple fields), check out GREL, an editing syntax developed for use inside OpenRefine. That is for more advanced users though. Just know that the power exists.
Happy data wrangling!